Visual SQL
Visual SQL is where a bulk of the magic happens–it’s the interface you’ll use to create your charts. As the name suggests, we’ve made SQL visual, to empower users of all backgrounds to explore their data. It’s intuitive for business users, fast for power users, transparent for SQL pros, and flexible for programmers. It truly is data for all!

When you create a new chart, Visual SQL opens with an expanded Query in Visual Mode where you’ll edit and execute your initial query. From there, you can transform your query result, view the result sets of those transformations, and ultimately visualize those results to add to your dashboard and share with your organization or team.
Quick Start
For a crash course in building a chart, check out our Quick Start Guide.
Explore
Have a quick query you want to try out, but don’t want to save it to a dashboard yet? Click Chart in the top navigation bar to open a Visual SQL window that’s not attached to any dashboard. If you decide to save your chart to a dashboard, you can do so via the Save to Dashboard menu.
This might feel like some uncharted territory, so let’s help you navigate the interface.
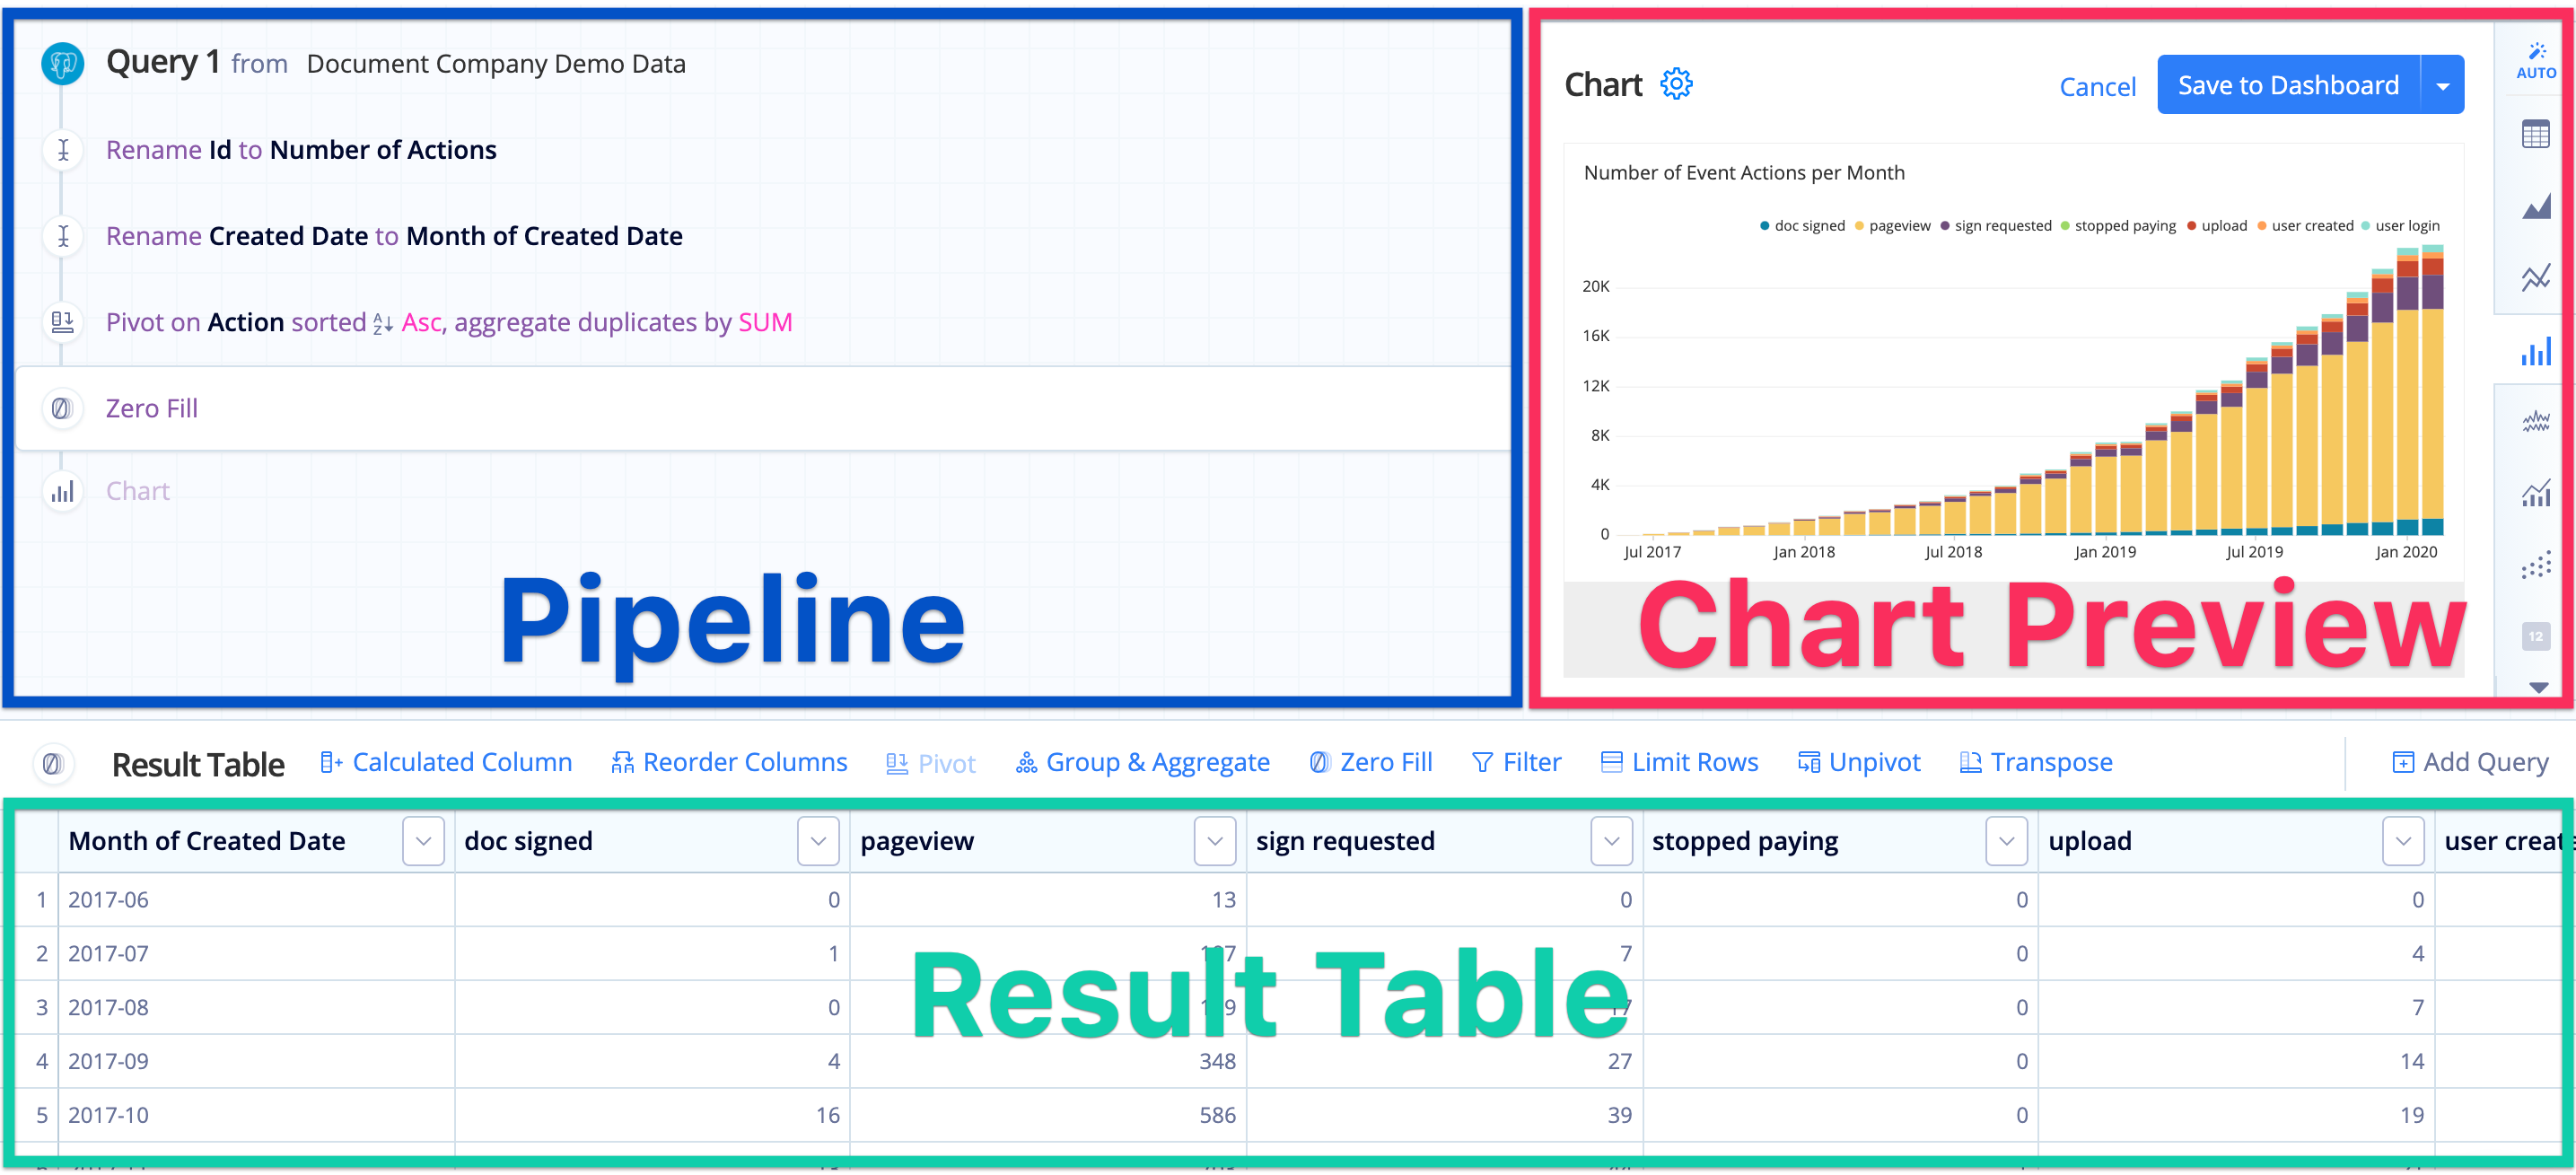
Visual SQL has three main sections:
- The Pipeline shows the series of query and transformation steps taken to achieve your final result set
- The Result Table shows the result set for the selected Action in the Pipeline
- The Chart Preview shows your chart and lets you customize the chart settings

Pipeline
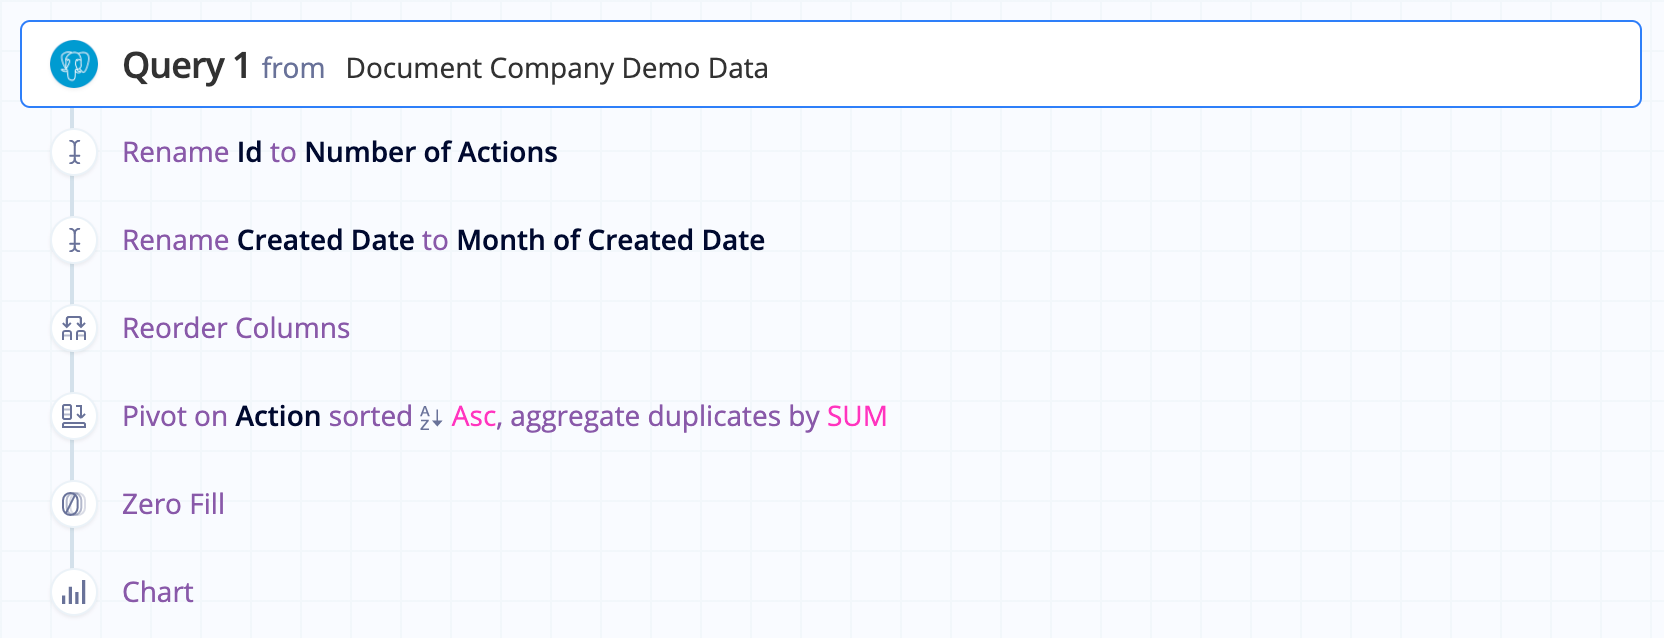
Chartio’s Pipeline allows you to perform transformations on your initial query results in a series of steps called Actions. These Actions include a variety of operations such as sorting columns, pivoting data, and adding calculated columns. The flexibility of adding Actions in any order allows you to get your data exactly how you want it.

Add an Action
New Actions are added under the currently selected Action in the Pipeline. If you want the new Action to be the last step, make sure you select the last Action before adding the new one. You can add as many Actions as you’d like, in any order. You can also use each Action multiple times as needed.
Some Actions even allow you to add custom transformations using our built-in formulas and SQLite syntax.
Note: Actions are applied in order from first to last, so in some cases, it is possible for a later step to override an earlier one.
Edit or Remove an Action
If you need to make changes to an Action or remove it altogether, you can do this by hovering over the Action block in the Pipeline then click the Pencil or Trash, respectively.
Alternatively, you can double-click an Action in the Pipeline to edit it.
Note: Deleting a Query Action from the Pipeline also deletes any transformation Actions applied to it.
Reorder Actions
There are some cases where you can add the reordered Action as if it were a new one, as described under Add an Action. Then delete the Action from its initial location in the Pipeline and edit other steps as needed. Be aware of reordering steps involving renamed or hidden columns – it might cause the query to fail.
Here’s a quick example:
Let’s say we want to reorder the Pivot Action to the second step in the Pipeline. We add the Pivot to the target location then delete the Pivot in the old location. Because we pivot the columns sooner, we no longer need the Rename Action for the Id column, so we can delete it. Note how Chartio also gives nice error messages to help you debug. Once we’re done, we click Run Query again to execute our newly ordered Pipeline.
Undo or redo
Quickly undo or redo Actions and other changes by clicking the left or right arrows, respectively, at the right of the top nav bar. Maybe you accidentally deleted an Action. No problem—just undo the deletion to quickly restore it! You can even keep clicking the Undo button to go all the way back to the initial state of your chart in your current session.
Keyboard shortcuts! To undo, try using Cmd + Z (Mac) or Ctrl + Z. To redo, try using Cmd + Y (Mac) or Ctrl + Y or Ctrl + Shift + Z.
Preview data
To preview your data at any point in the Pipeline, click the Action in the Pipeline and you’ll see the result set shown in the Result Table. It can be incredibly useful to compare how your data looks before and after a transformation step is applied.
Result Table
The Result Table is where the result set for your Actions are shown. As mentioned in the Preview Data section above, you can review the result sets to get a better understanding of what happens in each transformation step.

Resize the Result Table
Hover over the top border of the Result Table then click and drag the bar to change the table to the desired height.
Column data types
Check the column’s data type in your result set by hovering over the column’s name in the Result Table—the data type appears in parentheses. Knowing a column’s data type can be helpful for troubleshooting, especially when performing arithmetic operations.
Chart Preview
The Chart Preview pane is where you select your chart type and modify your Chart Settings. The Chart Preview always shows the final result set in your Pipeline; it does not update for individual Action results.
Click Untitled Title above the chart preview to quickly give the chart a title then press Enter or click outside of the text field to save the new title.
Chart Settings
Click the Gear at the top-left of the Chart Preview to view available settings. Each chart type offers different customization options. Check out our Chart Settings page for more info.
Popular chart features:
Save to Dashboard
When you’re ready to save your chart to a dashboard, click Save to Dashboard at the top-right corner. With new charts, you can choose from the list of existing dashboards or you can create a new dashboard. Upon saving, you’ll be redirected to that chosen dashboard.
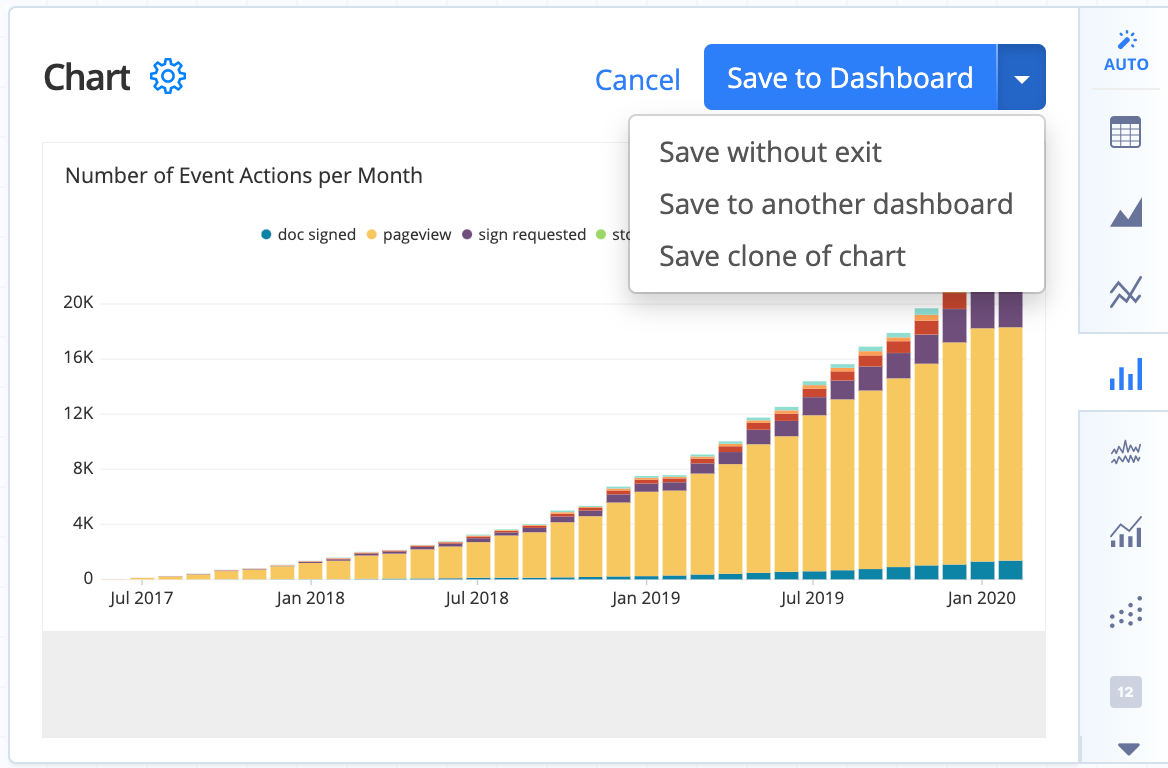
When editing an existing chart, you have a few more save options when you open the Save to Dashboard menu:
- Save without exit - Save your changes but stay in the Visual SQL editor upon saving
- Save to another dashboard - Save the chart to a different or new dashboard
- Save clone of chart - Save the chart to the same or different dashboard–think of this like a “Save As” option.
