Start a Query
Queries are the cornerstone for creating charts. This is where you’ll pull the data you want to show. All charts must start with an initial query; to help you remember this, all new charts have the first Query Action added and expanded for your convenience!
Choose a data source
Before you can start building your query, you need to decide from where to query the data. Choose one of your connected data sources by clicking the Data Source dropdown from the top-left corner.
Don’t have any data sources listed? Let’s fix that! Check out our data sources documentation for how to add some.
Choose your preferred mode
Now you can actually query data! Queries have two modes:
- Visual Mode - Quickly add columns and filters and let us generate the SQL query for you
- SQL Mode - Write out your own SQL query from scratch
Use either mode (or both modes!) as a method to pull data from your selected data source.
Execute your query
When you feel like your query is ready, click Run Query to execute it. The Result Table and Chart Preview will update with your query results.
Keyboard shortcuts! You can also use Cmd + Enter (for Mac) or Ctrl + Enter to run your query.
The executed query depends on which mode is currently active. If you’re using Visual Mode, the auto-generated SQL query is executed; if you’re using SQL Mode, your custom query is executed.
Note: Making changes and executing the query in Visual Mode updates the query in SQL Mode, but this isn’t true for the reverse—making changes and executing the query in SQL Mode doesn’t affect what’s shown in Visual Mode. If you’re switching between Visual Mode and SQL Mode, your changes to Visual Mode don’t impact your returned results until you re-execute your query from Visual Mode. Also, be aware that re-executing the query in Visual Mode may override changes you’ve made in SQL Mode. We understand this might be a bit confusing. Maybe our FAQ on editing in both modes will shed more light on the subject.
After running your first query, you can start adding other Actions to your Pipeline to further transform your data.
| Run Query button - Visual Mode |
|---|
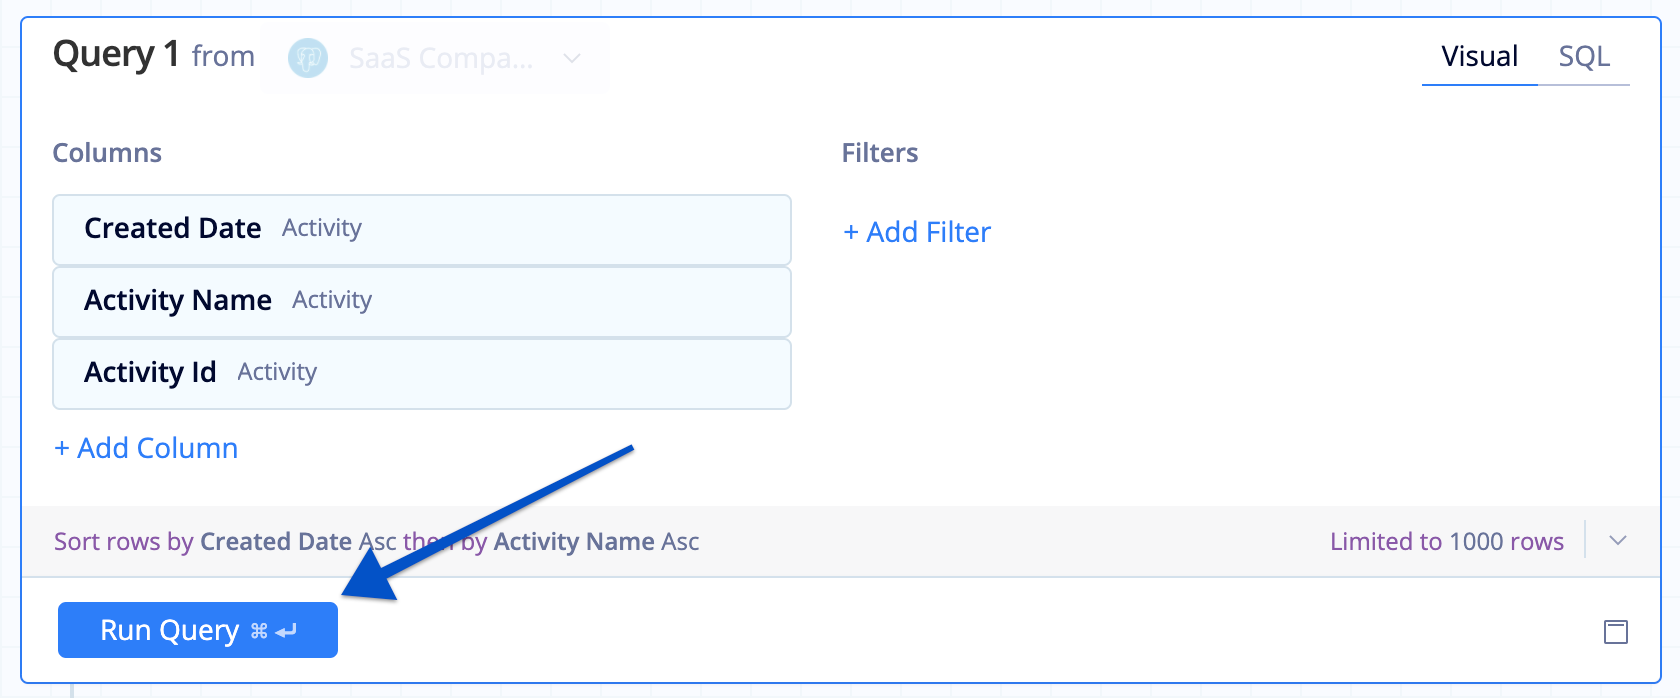 |
| Run Query button - SQL Mode |
|---|
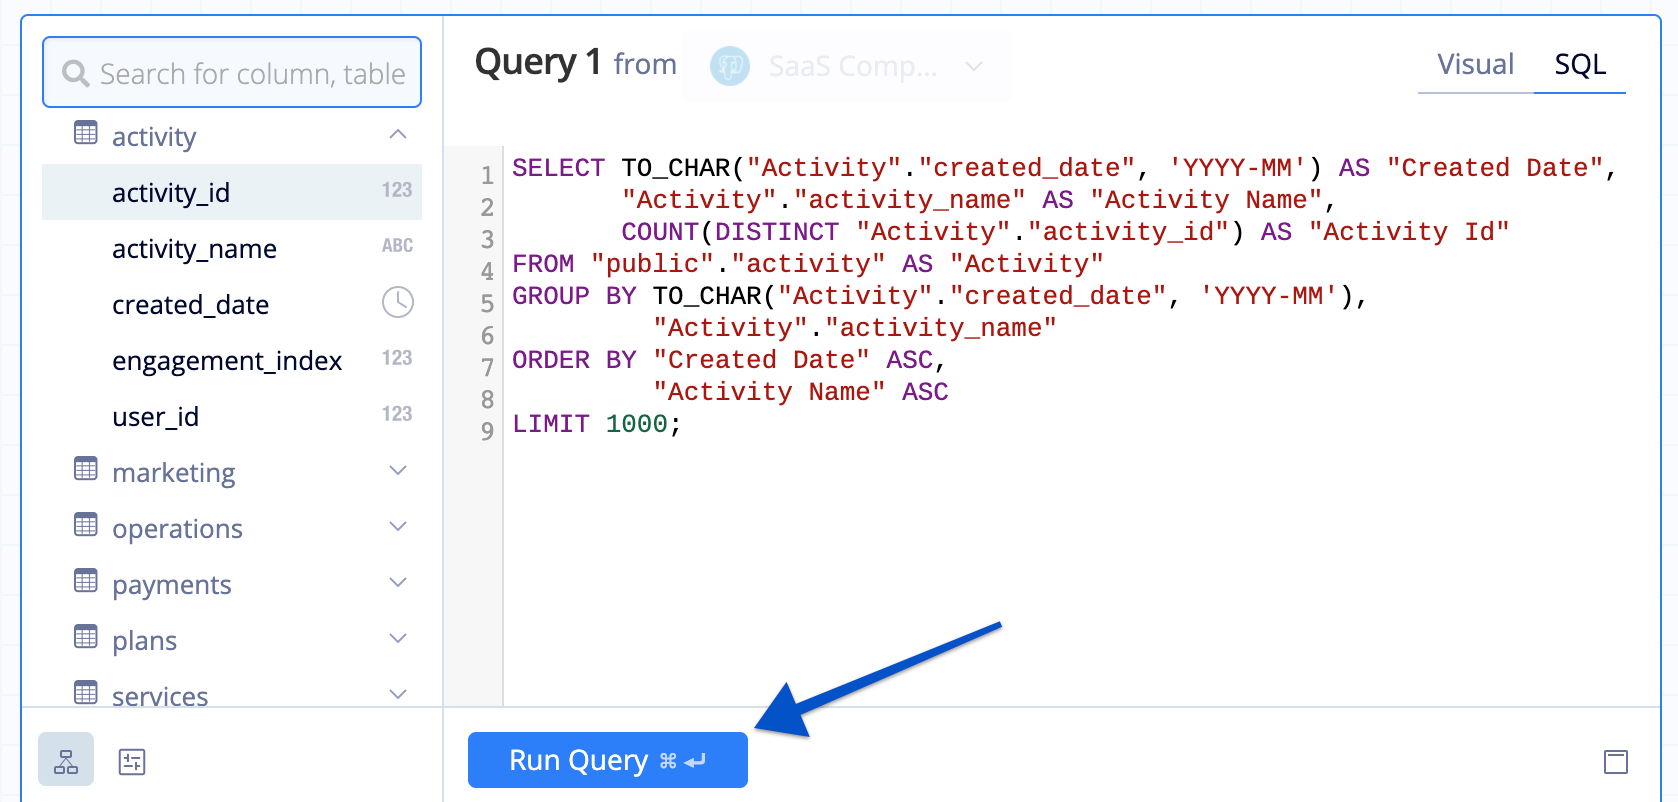 |
Executed SQL query and completion time
After executing your query, you can view the amount of time it took to complete next to the Run Query button. Clicking the completion time shows the executed query, including the values used for any Dashboard Controls referenced in your query.
