Data Stores
Data Stores allow you to save query results as a new data source.
A Stored Table contains query results that have been saved as a new data source. A Data Store is a collection of one or more Stored Tables.
Creating a Stored Table is similar to creating a chart. You can join data sources and apply transformations to the data in the Pipeline to get your data exactly how you want it. But ultimately, the data is piped into a database table (the Stored Table) rather than a visualization. You specify a name for that table and what time of day you’d like to refresh its data; Chartio will continually keep it up-to-date. You can then make other visualizations and Dashboard Controls with this Data Store, just like any other data source.
And just as you would for regular tables within the same data source, you can create foreign keys between Stored Tables within the same Data Store.
To keep your Data Stores organized and permissions separate, you may want to group Stored Tables into separate Data Stores.
Uses for Data Stores
-
Improve query performance with pre-aggregated data
It’s not uncommon for someone to be querying hundreds of billions of rows of data for several different charts on a dashboard, and multiple queries like that can be extremely taxing on your warehouse and can take a long time to complete. The best thing to do in cases like this is a create a pre-aggregated summary table. You can write your own scripts to create and manage these summary tables or you can use Chartio’s simple Data Stores.
-
Create simplified, team-specific data sources
Data Stores are commonly used to provide a simple, cleaned dataset for your team. Marketing, for example, may have fairly complex schemas on many different sources in various stages of mess. They may find the raw version too complex or inconsistent to easily explore. You can simplify the process for them greatly by utilizing Data Stores with clean, aggregated, simplified tables for them.
-
Join multiple data sources and apply frequently used transformations (calculations, filters) directly to data source
You may find that many charts are relying on very similar or the same subquery; it’s also very common to have to frequently merge the same sets of data together as a basis for several different visualizations. Whatever the reason, if you are finding that you are having to repeat yourself a lot you should consider storing the results of that base query into a data source. From there, your charts can more easily and more responsively work off of that Data Store table and don’t have to include all the same building steps each time.
-
Write SQL against Google Analytics
Permissions
You’ll need to be an account Owner to create a Data Store. Granting users Admin access to a Data Store allows them to edit the Data Store settings and create and edit Stored Tables inside that Data Store. Data Store Editors can view the schema and query log, as with other data sources. For more information on access permissions, check out our Data Source Permissions.
Security
Data Stores are stored on Chartio’s servers. We have implemented several features to ensure your data is secure.
- SSL encrypted connection
- Each Data Store is its own database, with its own unique user
- Data Stores are only accessible from our internal servers and are not external-facing
- Upon disconnecting a Data Store, all tables and data are immediately deleted
Limitations
Currently, Data Stores only support up to one million rows of data. This is by design, as they’re intended to be summary/aggregate tables, which ideally don’t get too big. They’re a helpful tool that cover about 80% of use cases but is definitely not a full Extract, Transform, and Load (ETL) solution. If you need larger aggregate tables, you’re entering ETL territory and need to perform those actions on your database or warehouse. Keep reading to see our tips for doing this.
Tips to overcome Data Store limitations
Summary tables and views
Data Stores are similar to summary tables that Chartio makes a bit easier. You can do them on your own database as well if you’re working with a lot of data, or just want to have more control. To do this, create views or persistent tables that simply store the results of your query. Each database deals with this in different ways and the documentation is widely available.
ETL tools
If you need help automating the creation of these tables, especially if your data is coming from multiple sources, you may want to use one of the many great ETL tools available such as Stitch or Xplenty. They work similarly to Chartio’s Data Pipeline but are designed for much larger sets of data and have more granular control over the timing and failover events of your operations.
Creating a Data Store
Permissions required: Owner
Creating a Data Store is a two-part process:
1. Create a Data Store
From the top navigation bar, click Data to go to your org’s data sources page then switch to the Data Stores tab and click the +Add a Data Store button.

Name your Data Store and set other connection settings as desired.

2. Create a Stored Table
Permissions required: Data Source Admin
Now you’re ready to add a Stored Table to your Data Store.
-
From the Data Stores tab, find your Data Store and click the +Stored Table button.

-
This redirects you to the chart editor (Visual SQL or Data Explorer).
Select your data source, then select data as you would for a chart. Add queries and Pipeline steps as needed.
Editing column names
When editing your Stored Table, be careful when changing column names. Doing so will break any existing charts that are using the Stored Table.
SQL Mode
If you’re creating a Stored Table in SQL Mode, you’ll need to use special syntax to apply a limit at the end of your query:
LIMIT {QUERY_LIMIT};
This ensures that the Query Limit in your Stored Table settings (see below) is applied to your query.
Stored Table Settings
- Table Alias: The display name used for your Stored Table.
- SQL Name: The table name you’ll use when using the Stored Table in a SQL Mode chart. It is auto-generated from the Table Alias. The SQL Name cannot be changed - this is to prevent breaking any charts that reference the SQL Name.
- Refresh Period: determines how often the query data is automatically refreshed. Options available include:
- Never
- Hourly
- Daily
- Weekly
Note: If your query returns a lot of results or takes a long time to run, you may want to set your Refresh Period to weekly or nightly.
- Day of Week: Schedule the day of the week your Stored Table query fetches new data; only applicable when you select “Weekly” for the Refresh Period.
- Hour of Day (UTC): Schedule the hour of day when your Stored Table query fetches new data.
- Query Limit: Limits the number of rows included in your Stored Table. The maximum is 1 million rows. The limit is applied to each dataset, and a 1 million row limit is applied to the chart overall.
-
Max Query Duration: Optional setting that overrides the queried data source’s maximum query duration.
If you want to allow your Stored Table query additional time to run, set the Max Query Duration in your Stored Table settings. The maximum possible query duration for Stored Tables is 30 minutes.
Max query duration for refreshes vs. chart queries
The 30-minute maximum only applies to Stored Table refreshes, not queries for a chart. If querying a Data Store for a chart, the hard limit for Data Store query durations is 60 seconds.
- Query Time Zone: Specify the time zone conversion for the query’s data
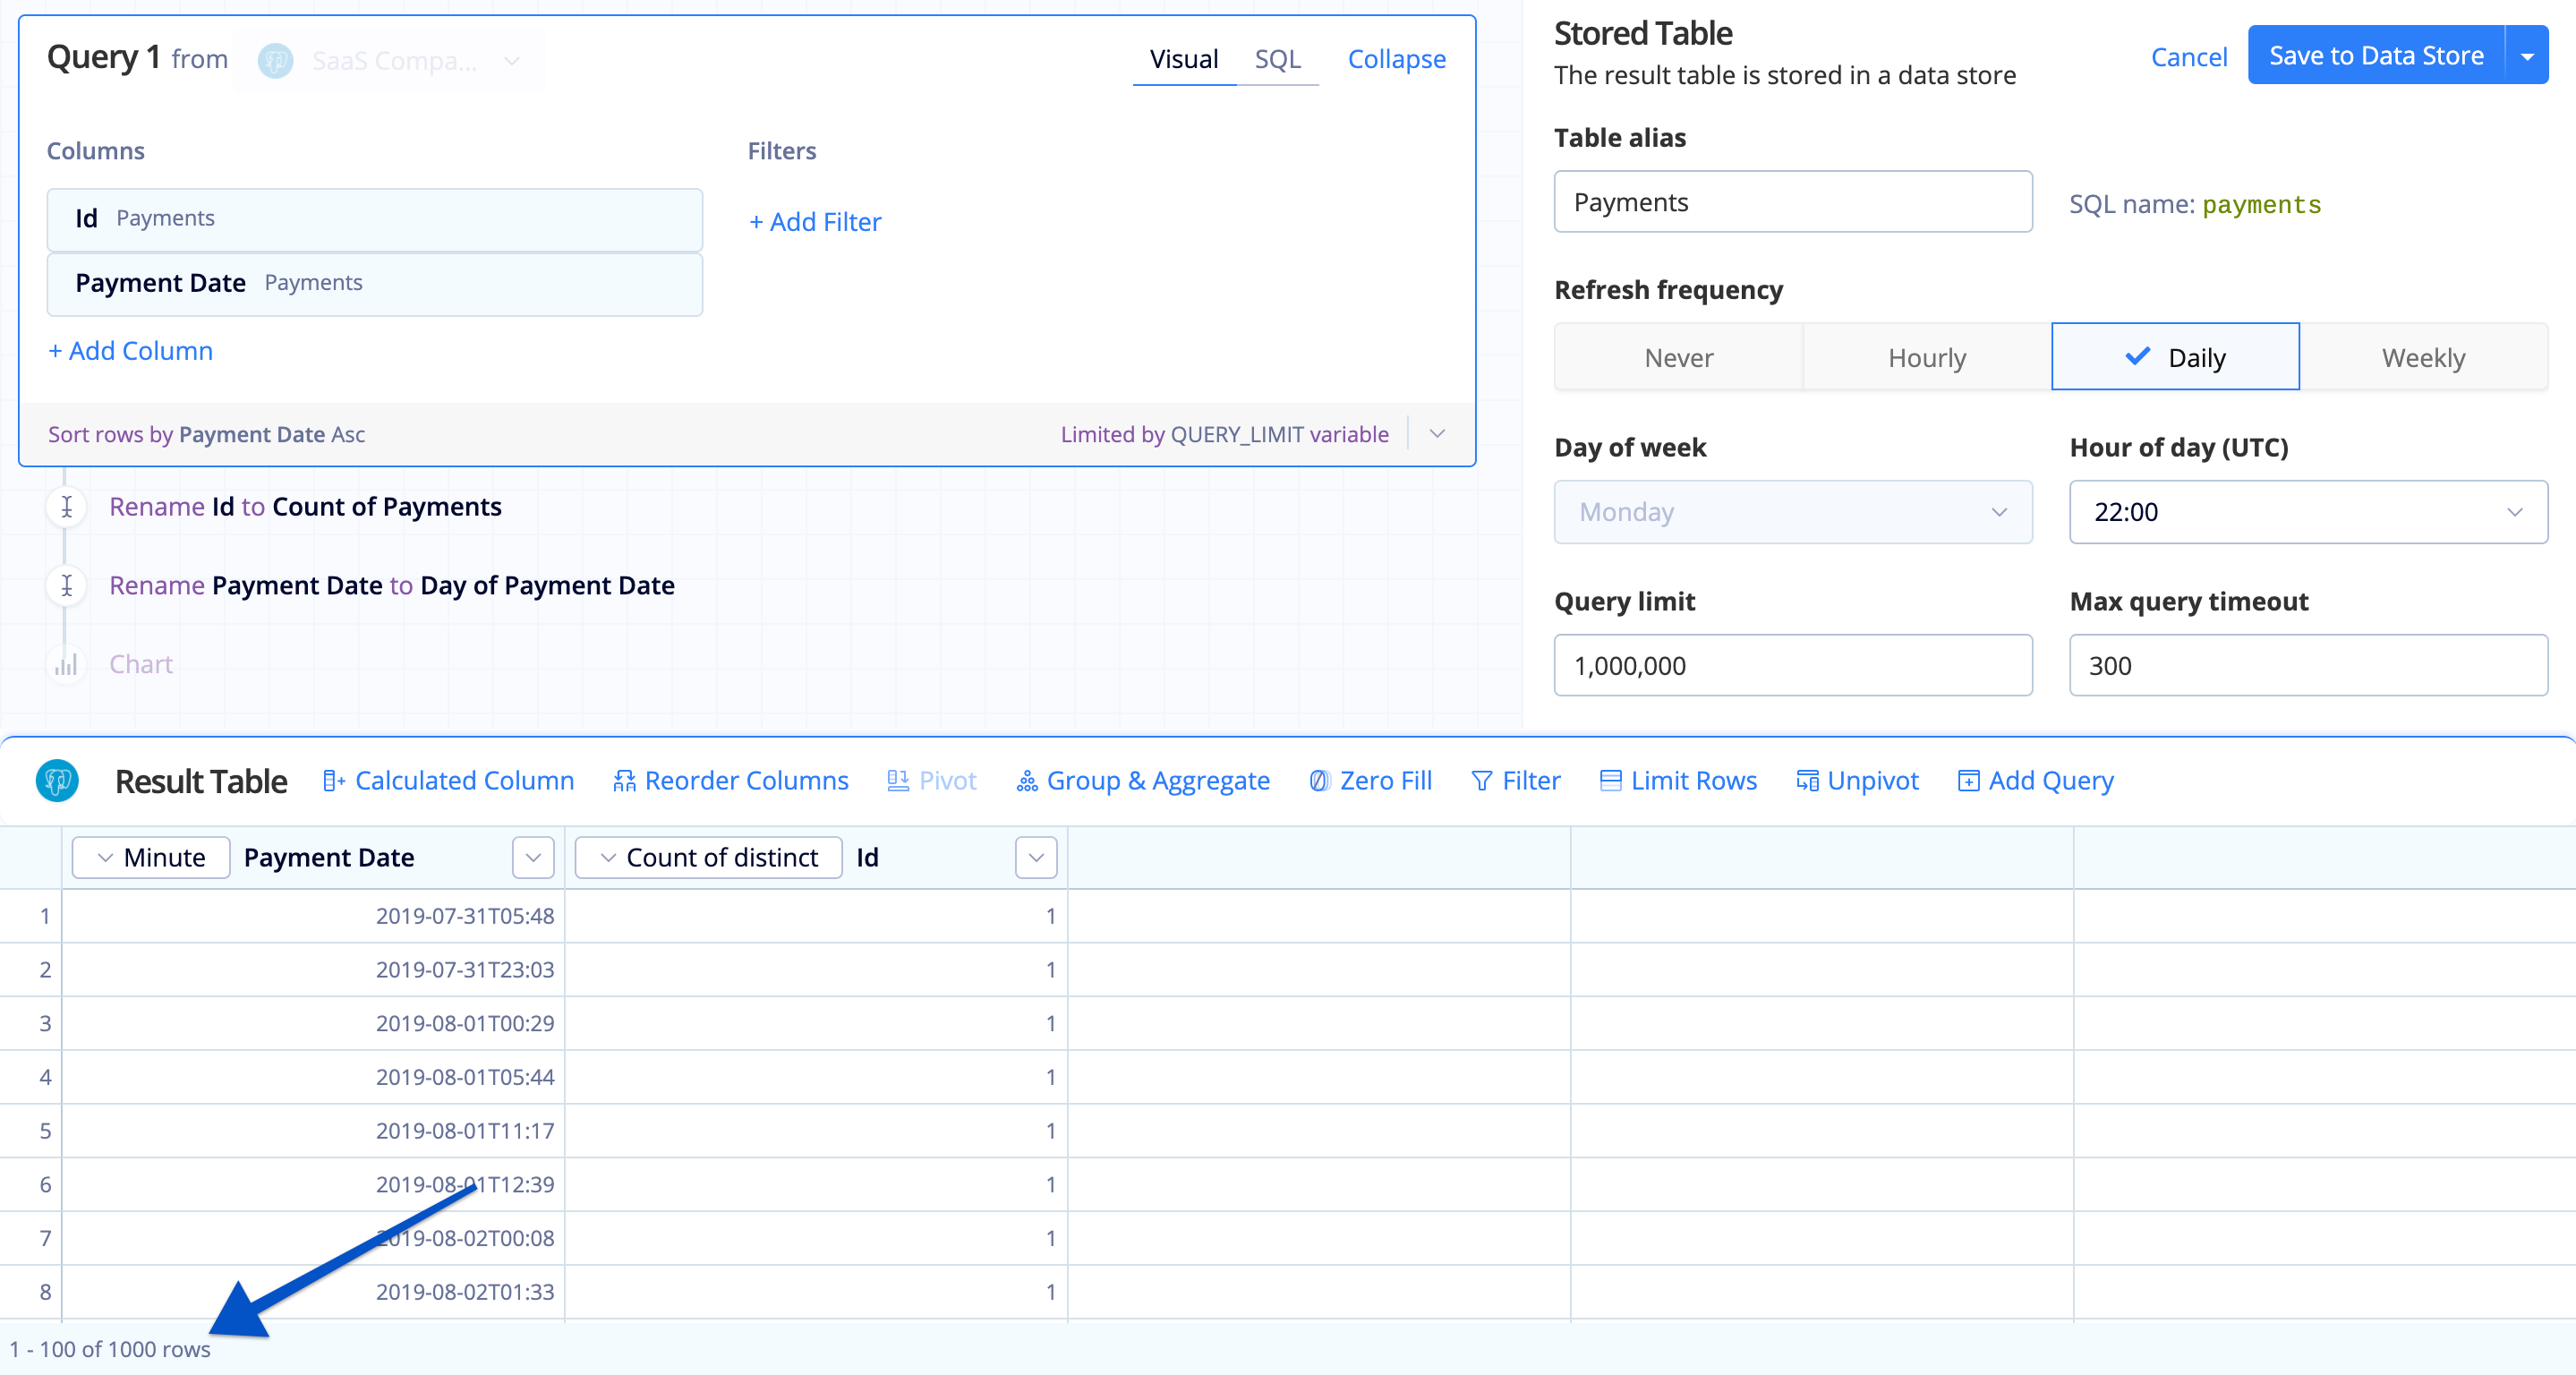
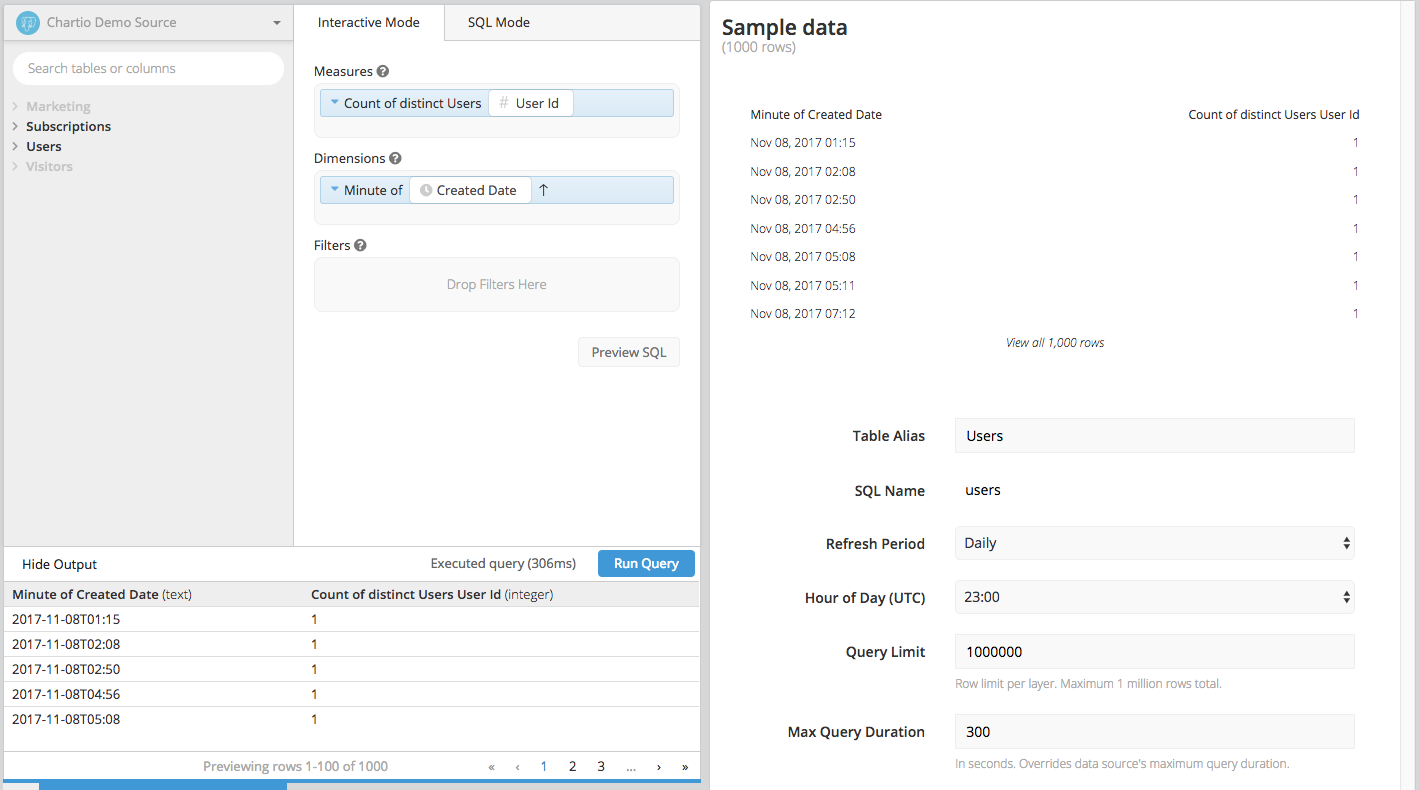
Data Store preview
If your Stored Table’s query limit is set to 1 million but you’re only seeing 1,000 rows in the Preview Table after running your query, this is because the Data Store builder will only display the first 1,000 rows of data as a preview.
When you query the Data Store with the 1 million row limit, you’ll query against all 1 million rows. The actual Stored Table will respect the limit you’ve set, but we don’t display all 1 million rows for performance reasons.
| In the Visual SQL interface |
|---|
 |
| In the Data Explorer interface |
|---|
 |
Using your Stored Table
Once you save your Stored Table, you’ll be redirected to the full list of Data Stores and their Stored Tables. Your Stored Table will not run until its scheduled time, but if you want to use it immediately, you may manually refresh it by clicking its Refresh icon.

Once your Stored Table has finished loading, you can use it to create charts as you would any other data source.
Note: Stored Tables are saved in a PostgreSQL database, so you must use PostgreSQL syntax for SQL Mode queries.
Foreign keys
To use more than one Stored Table in the same Visual Mode query, add foreign keys between the two tables in the Data Store’s schema. The two Stored Tables need to be inside the same Data Store. To access the Data Store’s schema, click its name from the full list of Data Stores.
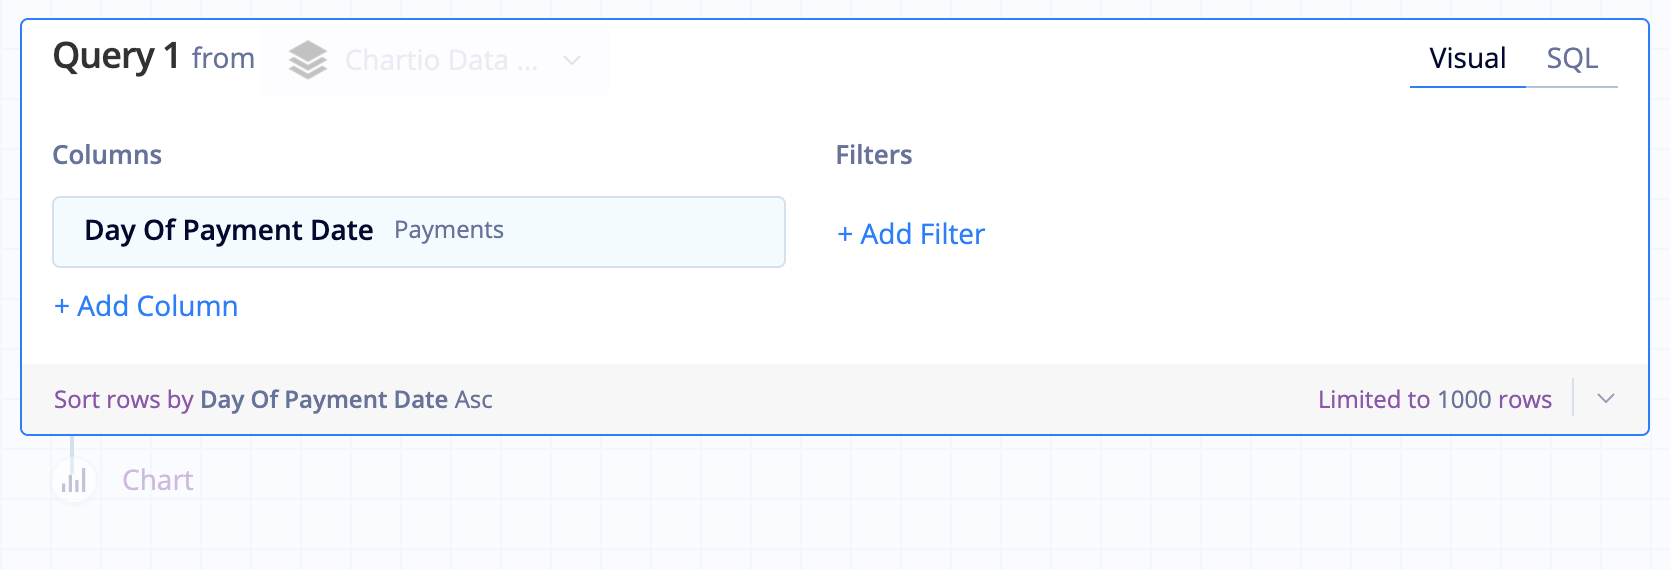
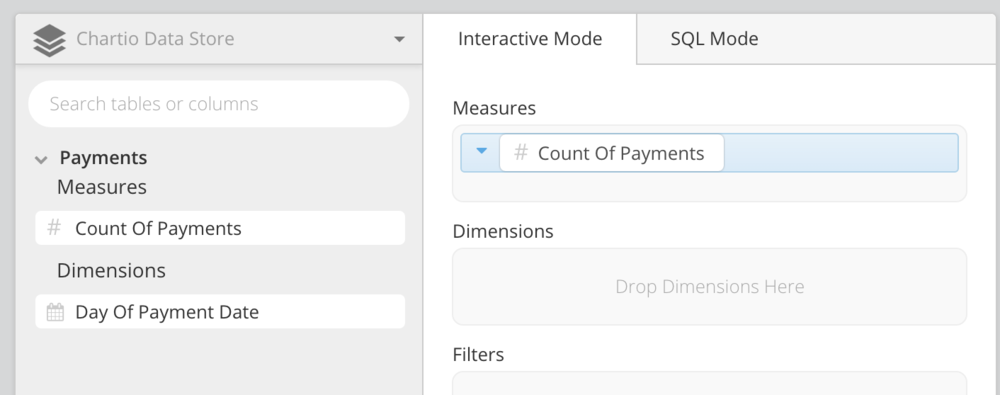
Time zones
When data is added to a Data Store, it is saved in UTC. To convert the data to another time zone, use the Time Zone Support Data Store setting to convert the Data Store data in your chart queries to the desired time zone.
| In the Visual SQL interface |
|---|
 |
| In the Data Explorer interface |
|---|
 |
Managing your Data Store
The Data Store settings tabs are almost the same as any other data source’s settings; there are a few differences:
- No Connection tab
- No Debug tab
- The option for Primary Admins to receive error emails in the Access tab
For more information about your Data Store settings, refer to our Manage Data Sources page.