Manage Schemas
Permissions required: Data source Admin
When Chartio connects to your data source, it automatically extracts your data source schema(s). Chartio provides an editor for the schema(s) we import, which allows you to perform the following actions:
- Rename tables or columns to make them more reader-friendly
- Hide tables and columns to simplify your data source for users
- Delete columns and tables (from your Chartio schema, not your actual data source)
- Add foreign keys, if needed, and set custom join types
- Change dimension and measure groupings
- Set default aggregations for measures
- Create custom columns or tables
Access your schema
To find your schema, select Data from the top navigation, choose your data source from the list, then switch to the Schema tab.
If your data source has multiple schemas, you can select a different schema from the Schemas list on the left.

Add a schema
Trying to add another schema to your Chartio data source? Check out our instructions for adding multiple schemas.
Edit your schema
Edit table alias
Click the Pencil icon next to the table’s name to edit the table’s alias then click Save to apply your changes.
Updating a table’s alias won’t break any existing charts using this table because the SQL name of the table won’t change. The table’s SQL name is shown in parentheses under the table’s alias.
View and edit columns
Click the arrow next to the column’s table name to see all the table’s columns. In each column’s row, you can see its Alias, SQL Name, Type, and Foreign Key, and toggle its visibility. You can then open an individual column’s settings by clicking anywhere on the column’s row to view and edit its settings.
- Alias
- This is the column name you see in Visual Mode (Visual SQL) or Interactive Mode (Data Explorer).
-
Updating a column’s Alias won’t break any existing charts using this column because the SQL name of the column won’t change.
- Description
- Add column definitions that your users can view when building charts.
-
Note: For newly added columns or data source connections, Chartio can import the Comment of a column if it exists in your data source and automatically set it as the column’s Description.
-

-
Users will see this description whenever they hover over the column name in the table preview of Visual SQL or the column name in Interactive Mode of Data Explorer.
| In the Visual SQL interface |
|---|
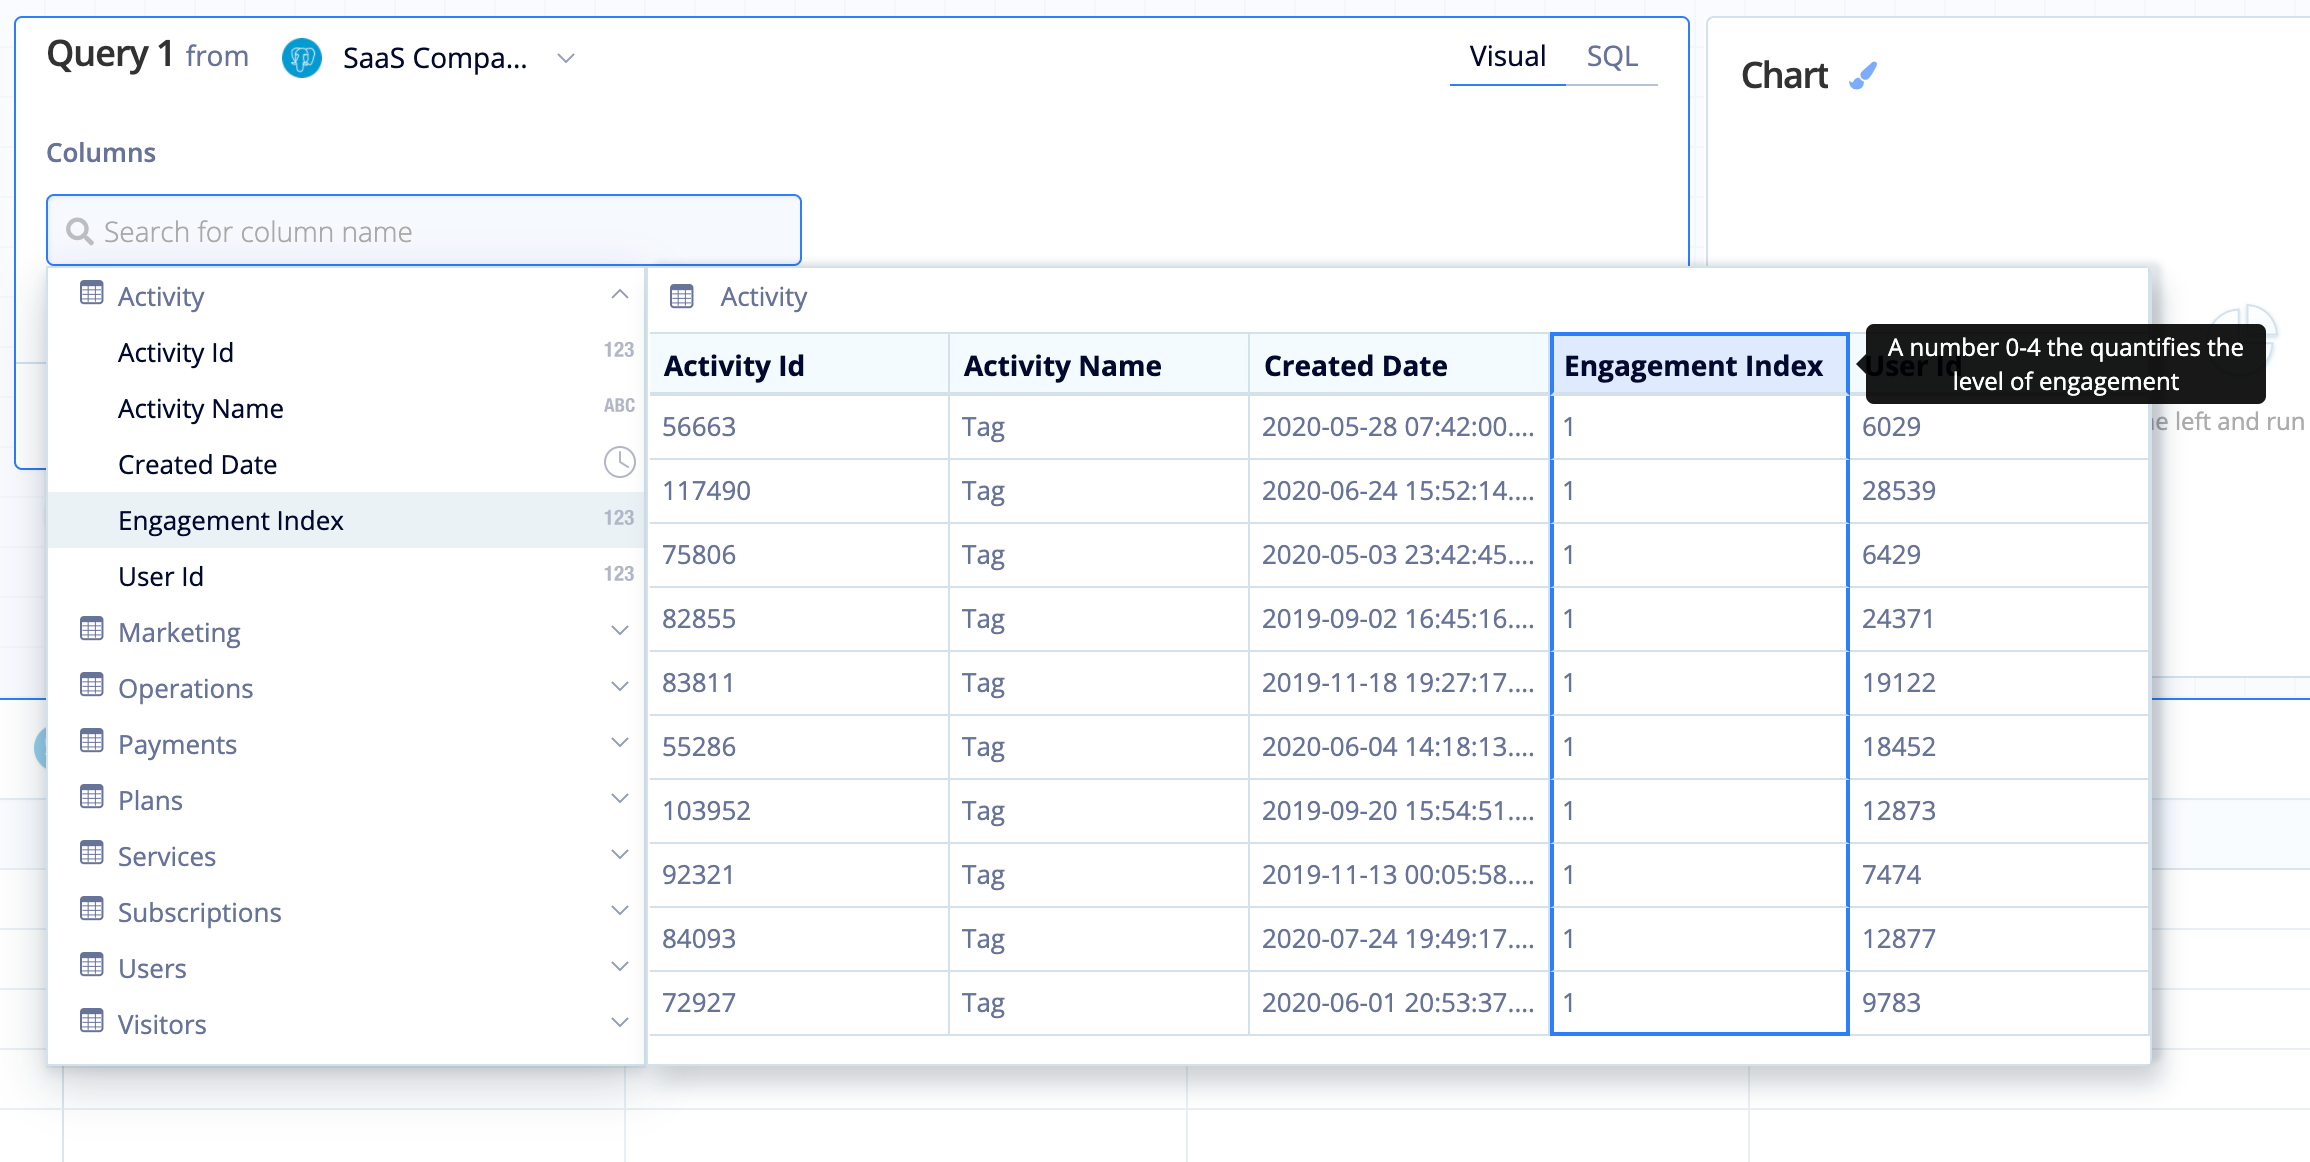 |
| In the Data Explorer interface |
|---|
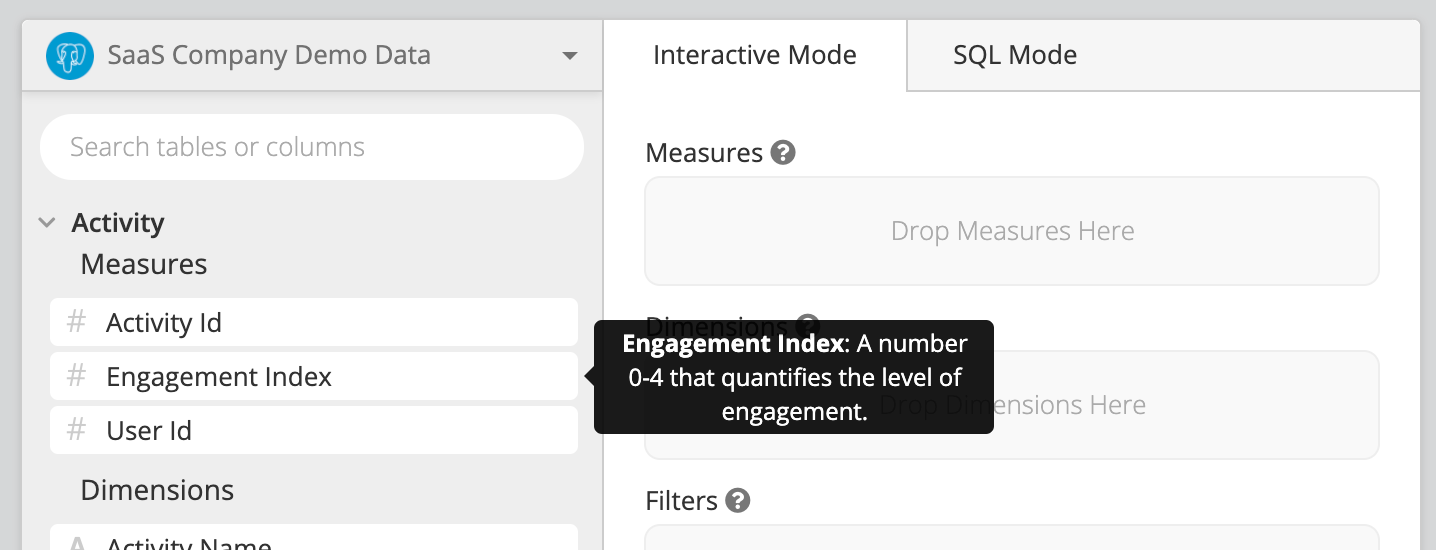 |
- Query
- The column’s SQL name
-
You use this SQL name when referencing the column in SQL queries (e.g., SQL Mode queries).
- SQL Type
- The column’s data type in your data source
- Type
- It’s difficult for Chartio to automatically recognize Unix timestamps when pulling schemas from databases. In the schema, they are simply marked as Number data types. You can, however, specify if the column is a Unix timestamp by changing this attribute to “Unix Timestamp (in seconds)”.
-
When the Type is changed to a Unix Timestamp, the chart editor automatically applies
FROM_UNIXTIMEfunctions to those columns when the queries are generated. -
Need to change the data type of a different column? Check out our FAQ for how to change a column’s data type using a Custom Column.
- Foreign Key
- If the column is a foreign key, you can specify the schema (if there are multiple), table, and column of the primary key it references. See below for more information on foreign keys.
- Grouping
- Choose either Measure or Dimension
-
If you choose Measure…
- When you select this column in Visual SQL’s Interactive Mode, you’ll see Aggregate operators in the column’s aggregation menu in the Result Table.
- When you use Data Explorer’s Interactive Mode, this column appears under the table’s Measures list of columns.
-
If you choose Dimension…
- When you select this column in Visual SQL’s Interactive Mode, you’ll see Group operators in the column’s aggregation menu in the Result Table.
- When you use Data Explorer’s Interactive Mode, this column appears under the table’s Measures list of columns.
- Default Aggregation
- Only shown when “Measures” is selected for the Grouping type
-
If you commonly use one particular aggregation for a measure, you can set it as the default in the schema. When you use the column in Visual Mode (Visual SQL) or Interactive Mode (Data Explorer), the default measure you choose is selected.
-
The available options are:
- Count of distinct
- Count of all
- Total sum
- Average
- Minimum
- Maximum
- Standard Deviation
- Variance
-

Hide or display columns and tables
If you have a lot of tables and columns, it’s often helpful to hide some of the ones you aren’t using. This can make your schema easier to navigate when you’re creating charts.
To hide a table or column, simply uncheck the Visible checkbox next to the table or column name.

You can also hide or display all columns or tables at once from the table’s ellipsis settings menu.

Delete columns and tables
Remove columns and/or tables from the data source’s schema in Chartio. This feature is useful if your data source includes tables that you will never need to query, particularly if your data source exceeds Chartio’s column and table limit for data sources.
Just to reiterate—removing columns and tables from your schema in Chartio does not affect your actual data source.
When deleting a column or table, Chartio shows you which charts are currently using it. If you remove a column or table that’s in use, the charts using it will change to SQL Mode and will not break.
Note: Removing columns and tables from your schema is entirely reversible. To retrieve deleted columns and tables, simply sync the schema and select tables/columns to add to your schema. However, this will not turn the charts that were changed to SQL Mode back to Visual/Interactive Mode.
- To delete a table, click the Delete button next to a table name.
- To delete a column, click the column name to open its settings then click the Delete Column button at the bottom of the column’s settings.

Delete schema
When you have multiple schemas in your data source, you can remove a schema from Chartio by opening the schema’s ellipsis settings menu and clicking Delete Schema. Alternatively, you can go to the data source’s Connection tab and de-select the schema from the schema selector then click Save.
When deleting a schema, Chartio shows you which charts are currently using it. If you remove a schema that’s in use, the charts using it will change to SQL Mode and will not break.
Note: To restore any deleted schemas, go to your data source’s Connection tab and re-select the deleted schemas from the schema selector, then click Save. However, this will not turn the charts that were changed to SQL Mode back to Visual/Interactive Mode.

Sync schema
If you make any changes to your actual data source’s schema, you’ll want to sync your schema in Chartio to make sure we have the latest version.
To sync your schema, click the Sync Schema button at the top of the schema editor. If your data source has multiple schemas, you can sync all schemas by clicking Sync All Schemas at the top of the schema settings.

Chartio brings in all tables and columns it has access to and makes them visible by default. If you’d like to hide new tables and columns brought in from your schema syncs, enable Hide New Tables in your data source’s General settings.
After a successful schema sync, you’ll see a small summary at the top of the page showing how many changes were made to your Chartio schema.

How renamed or removed columns affect Visual Mode charts
If Chartio detects missing tables or columns in your database are being referenced in Visual Mode queries, you’ll see a warning section appear at the top of the page. For more information about how to handle these database changes for your Chartio queries, check out our Manage Queries page.
Manual sync
Chartio cannot automatically detect changes and sync your data source schema.
You’ll need to manually sync the schema for any changes. Schema syncs are mandatory to use new tables in Visual/Interactive Mode, but in SQL Mode, you can query the new tables directly without having to update the schema.
Change History
View a running list of changes to your Chartio schema, when the changes were applied, and which data source admin applied those changes.

Foreign keys
Check out our video explaining foreign keys and the different ways to add them to your data sources in Chartio:
Foreign keys tell the database how to join two or more tables together in the same query. In Chartio, foreign keys allow us to join tables together in Visual/Interactive Mode. For most data source types, Chartio can import any foreign keys you’ve set up already. If Chartio is unable to import your foreign keys—or none are set up—you may need to define the foreign key relationships manually in the schema. You can use the Connect Tables feature to auto-detect possible foreign key relationships in your schema.
Note: Foreign keys set from the schema page are only added to Chartio’s metadata; changes here are not made to the data source itself.
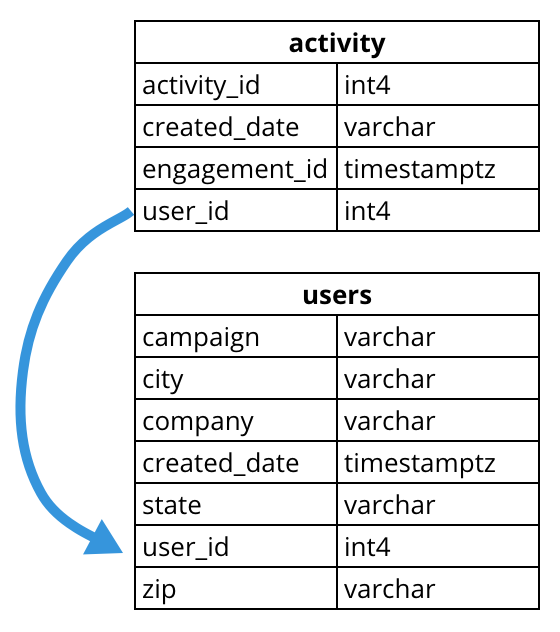
In the example below, the “user_id” column in the “users” table is the primary key. The “user_id” column in the “activity” table refers to the “user_id” column of the “users” table; therefore, the “user_id” column in the “activity” table is a foriegn key.
Connect Tables
When possible foreign key relationships in your data source are detected, the Connect Tables button at the top of the schema editor is enabled. This feature can be used in Chartio to assist in setting foreign keys between tables.

Upon clicking the Connect Tables button, a modal appears, showing foreign key suggestions. You can then review and approve foreign key selections before they’re added to your schema in Chartio.

Add a foreign key
You can manually add a foreign key to your schema by editing the column’s settings.
Here’s an example: We want to make a chart to count the number of activities per username. Activity information is stored in the Activity table, and each activity has a User Id associated with it. However, Username is in the Users table. This means we need to link the Users and Activity tables together; we can do this using the User Id column. When we do that, we can get any related information from the Users table when we query the Activity table.
In our schema, we’ll expand the Activity table to view a list of all its columns. Then, we’ll click User Id to open the User Id column’s settings. In the Foreign Key setting, we’ll select the Users table then select the User Id column.

Foreign key joins
Once foreign key relationships are defined, Chartio automatically performs joins for you when using columns from related tables in Visual/Interactive Mode. The tables don’t need to be directly related; Chartio automatically finds the closest path between a data source’s tables to join the two that you’re using.
Setting custom join types
By default, all join relationships generated in Visual/Interactive Mode are explicit inner joins. However, it’s possible to set a custom join type per foreign key.
To customize the join type between two tables, first find the column in your schema and click it to open its settings. Adjust the join type in the dropdown below the Foreign Key setting’s table and column fields. Click Save when finished.

Now whenever the foreign key is used in Visual/Interactive Mode, Chartio will use the join type you’ve selected.
Visualize your schema
To see a visual representation of how your tables are connected in Chartio, you can click the Visualize button at the top of the schema settings.

