Query Log Data Source
Chartio’s Query Log data source provides the ability to add your data source’s query logs as a data source.
At the heart of Chartio are all the queries that power your charts and dashboards. You can view all the queries that have been executed against one of your data sources from Chartio in each data source’s query log. The Query Log data source, on the other hand, lets you access and query your query log data across all sources from up to one year ago. Query metadata can be queried directly, giving you the visibility and insight to understand your data source load and optimize queries.
If you’re interested in seeing a demo or accessing this feature in your account, please contact support@chartio.com.
Querying the Query Log
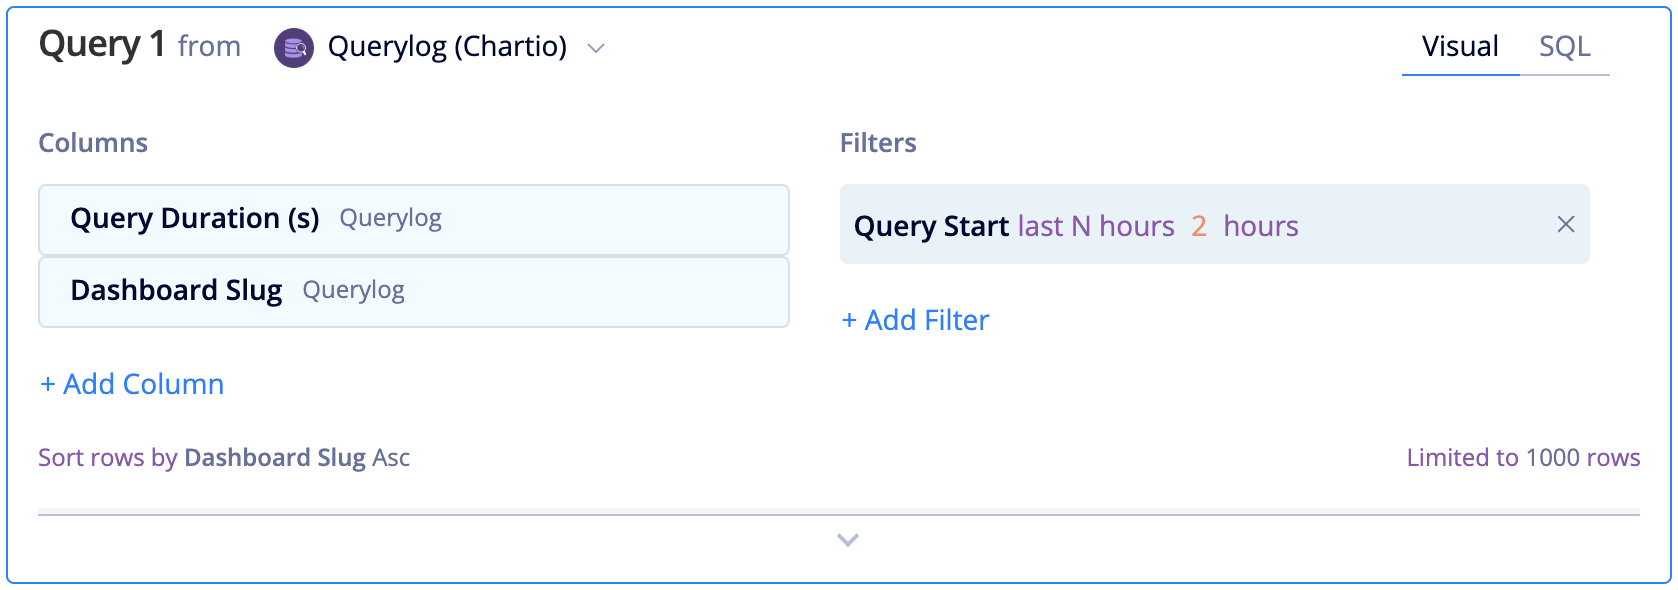
The Query Log data source is identified by a purple database icon and titled “Querylog (org name)”. You’ll be able to query the source in Visual Mode. SQL Mode has been disabled for this source to avoid complications with special SQL syntax.
To ensure quicker query times, always include Query Start in your query filters! If you don’t add a Query Start filter, the query will process ALL queries stored in the Querylog data source and will take a long time to execute.
| In the Visual SQL interface |
|---|
 |
| In the Data Explorer interface |
|---|
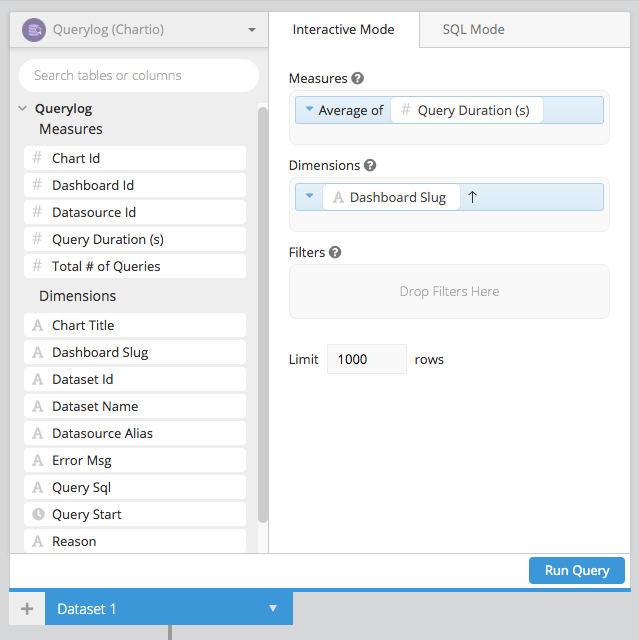 |
Note: If you have the Query Log Data Source enabled in your account, users will still need to be granted permissions to the data source in order to access it.
Query Log Fields
The following fields are available in the Query Log Data Source:
| Field Name | Field Definition |
|---|---|
| Chart Id | Unique identifier for charts |
| Connect Duration Ms | Time in milliseconds to connect to a customer database. Runs before query. |
| Dashboard Id | Unique numeric identifier for dashboards (this is not exposed in the UI) |
| Datasource Id | Unique identifier for datasources (this is not exposed in the UI) |
| Datastore Table Id | Unique identifier for data store tables (this is not exposed in the UI) |
| Google Bigquery Bytes Billed | Maximum bytes billed setting to limit query costs |
| Query Duration (s) | Time in seconds it took for the query to execute in Chartio |
| Rate Limit Duration | Time in seconds the query was in the rate limiter before executing |
| Rate Limit Retry Count | Number of times the query was placed in the rate limiter before executing |
| Total # of Queries | Total number of queries executed |
| Chart Title | Title of chart |
| Dashboard Slug | Unique identifier for dashboards used for the URL |
| Dataset Id | Unique identifier for datasets in a chart (this is not exposed in the UI) |
| Dataset Name | Name for each dataset |
| Datasource Alias | Name for data source |
| Dbtype | Type of data source (e.g., Redshift, Athena, Postgres) |
| Error Msg | Error message returned from the data source when the query errors |
| Google Bigquery Job Id | Unique identifier issued by BigQuery |
| Query SQL | SQL generated (when using Visual Mode) or SQL query (when using SQL Mode) executed against the data source |
| Query Start | Timestamp of when query started executing in UTC |
| Reason | Reason for why query executed (ex: dashboard load, chart editor, dashboard refresh, etc) |
| User Email | User email of user that executed query |
Query Reasons
| Query Reason | When Triggered |
|---|---|
| alert | Scheduled alert is sent |
| chart_editor | Query ran from the chart editor |
| dashboard_auto_refresh | Chart updated based on auto refresh setting |
| dashboard_load_initial | Loading the dashboard via page load |
| dashboard_refresh_chart_data | Choosing "Refresh Chart Data" from chart menu |
| dashboard_refresh_data | Clicking "Refresh Data" button |
| dashboard_report | Scheduled report is sent |
| dashboard_smart_refresh | Chart updated based on smart refresh setting |
| dashboard_update_drilldown_var | Changing the value of a drilldown variable |
| dashboard_update_vars_auto |
Changing a dashboard variable when dashboard is in "Auto Apply Variables" mode Updating a dropdown that relies on a variable Updating a hidden variable Clearing all filters on a dashboard |
| dashboard_update_vars_manual | Changing a dashboard variable and clicking "Apply Variables" on the top right |
| datastore_table | Data store table is run either manually or from scheduled time |
| embedded_dashboard | Loading an embedded dashboard (Embedding 1.0 only) |
| export_dashboard | Dashboard or chart is exported when the cached is expired |
| take_snapshot | Scheduled snapshot is taken |
| visualsql | Query ran from Visual SQL |
Query Log Dashboards
In addition, the Query Log Data Source comes with a set of pre-populated dashboards. You can find them under the Chartio Query Log category on your dashboard home page. The following dashboards will be added to your account with the Query Log Data Source:
- Chartio Query Log
- Dashboard Performance
- Pitfalls
- Query Search

If you’re missing a dashboard or would like to request a copy, please reach out to support@chartio.com.