The Power and Cost of Hurricanes
Posted by on October 13, 2017 Education, Data, Data Analytics, Opinion
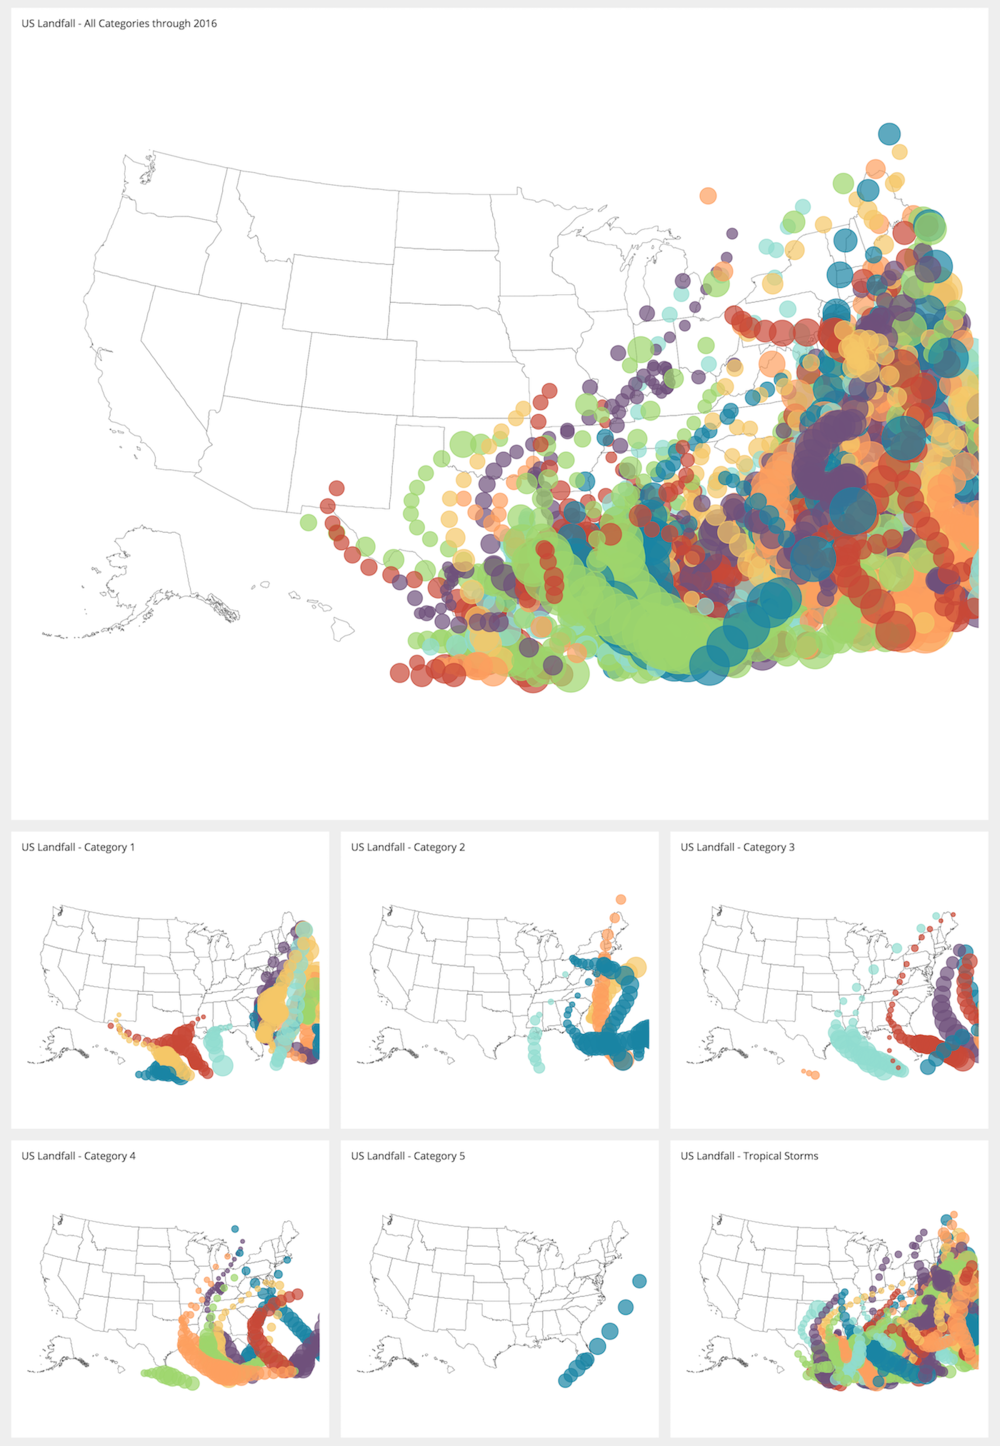
Every year, late in the summer, waves of warm air come off the African continent and enter into the warm open seas of the mid-Atlantic Ocean. When the conditions are right, these waves of warm air form into tropical depressions. Tropical depressions can then turn into a tropical storm, which is when the storms are given a human moniker thus becoming an official “named storm.” After that they can become hurricanes of varying intensity and severity.
These storms reach their peak intensity right as they are approaching the eastern Caribbean islands with the Leeward Islands in the Lesser Antilles often taking the brunt of the initial landfalls of these sometimes extremely powerful storms. Then after losing little to no intensity, these storms continue their onslaught on the Greater Antilles islands like Puerto Rico, Hispaniola (home to the Dominican Republic and Haiti), Jamaica, and Cuba or turning north and taking aim on places like Turks & Caicos and the Bahamas.
After that, they move out over open ocean again and re-gain whatever intensity they lost in their attack on the Caribbean islands and take on a strengthening posture and path that often leads them directly into portions of the United States along the Gulf Coast or a southern track towards Mexico.
No matter their path, these powerful forces of nature are indiscriminate to nation, socio-economic class, and race in the spreading of their destruction. Often times, these storms create billions of dollars of damage and cause many deaths in their wake. It is no surprise that natural abilities to cause such prolific damage garner the attention of people worldwide and the fascination of scientists and meteorologists alike. Therefore there is no shortage of data on these terrible phenomena.
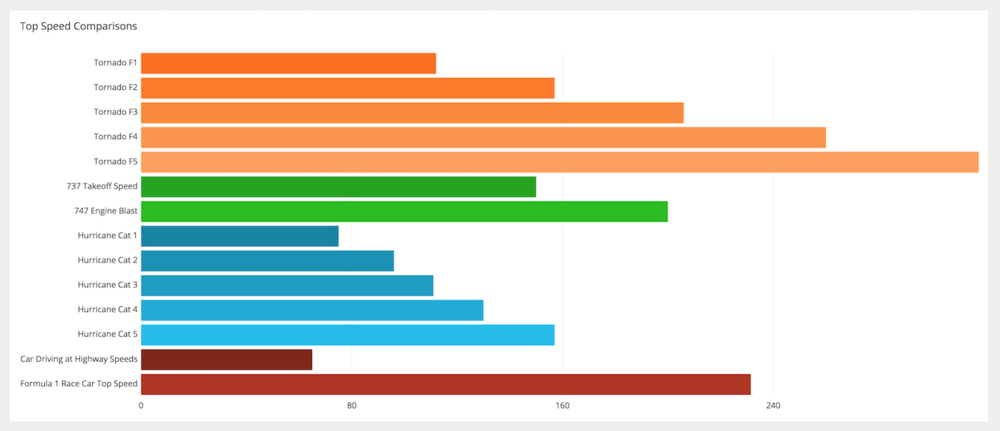
Hurricanes are categorized by a 1 - 5 scale called the Saffir-Simpson scale. I encourage checking out that link to see an animation displaying the awesome power of the hurricane force winds contained in each of those storm types. Then below, you can see how those wind forces compare with both natural and manmade phenomena.
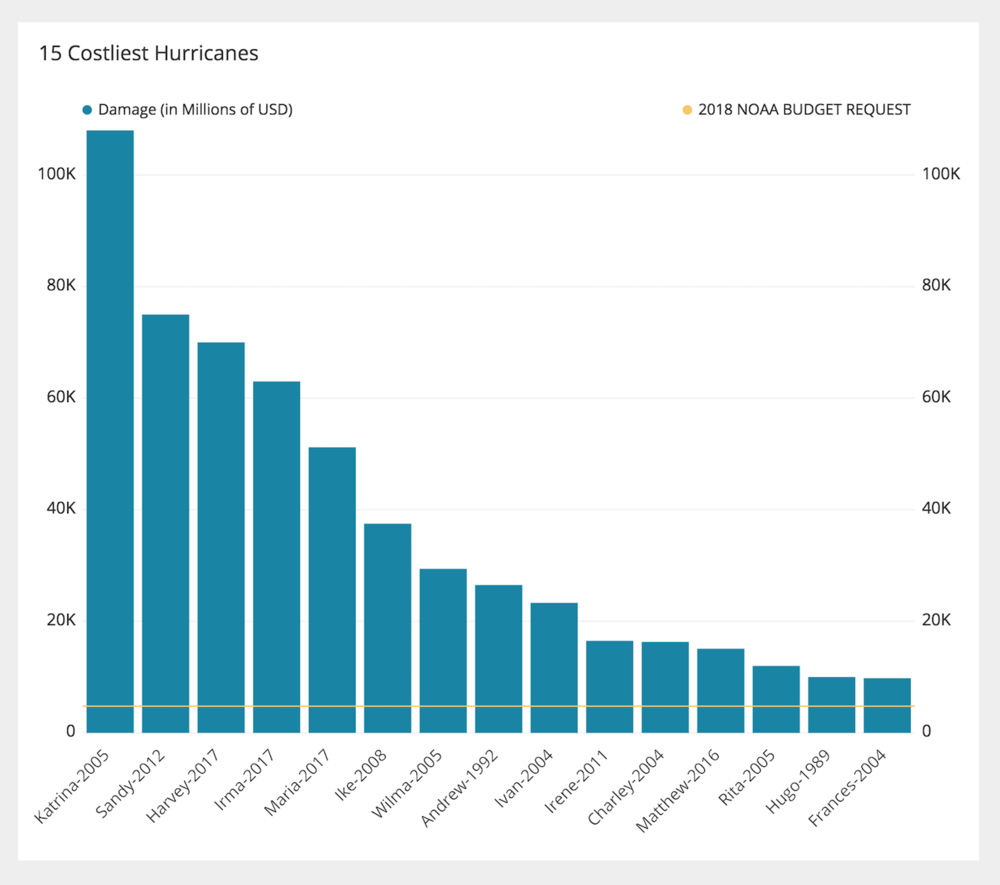
In the United States, the National Oceanic and Atmospheric Administration (NOAA) budgeted approximately $4.78 Billion dollars to be spent on weather related research and observational operations (according to the FY 2018 Budget Request by NOAA). This figure, as you can see, pales in comparison to the amount of money spent on recovery from the 15 costliest named storms in the chart below.
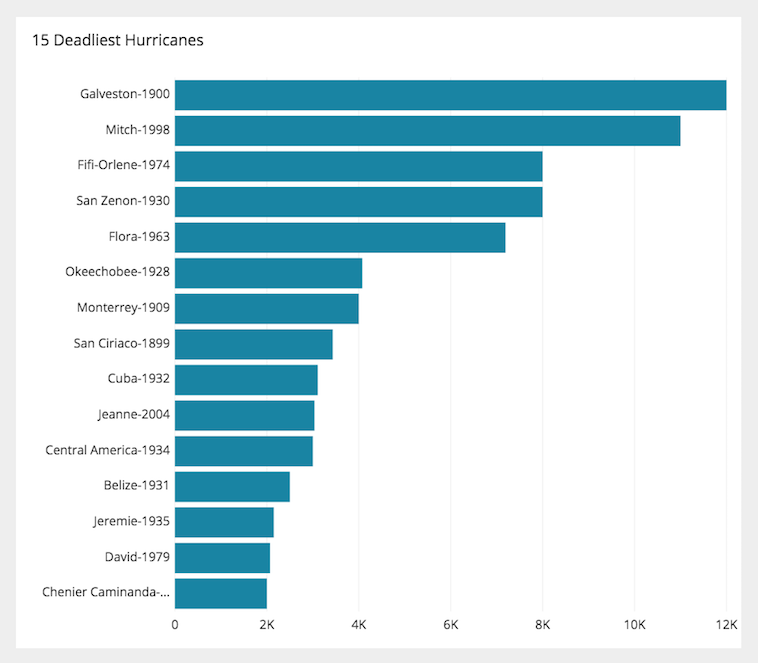
Speaking of costly storms, the monetary value placed on damage is nothing compared to the value of human life lost. The human cost of storms is one of, if not the, most important measures when discussing how much a storm costs. This display is outlined in the bar chart below.
Recently, in the United States and the Caribbean Islands, very large, dangerous and deadly storms ran through leaving vast destruction and death in their wakes. Two of those storms were Harvey and Irma, and both left their mark on two different areas in the continental United States.
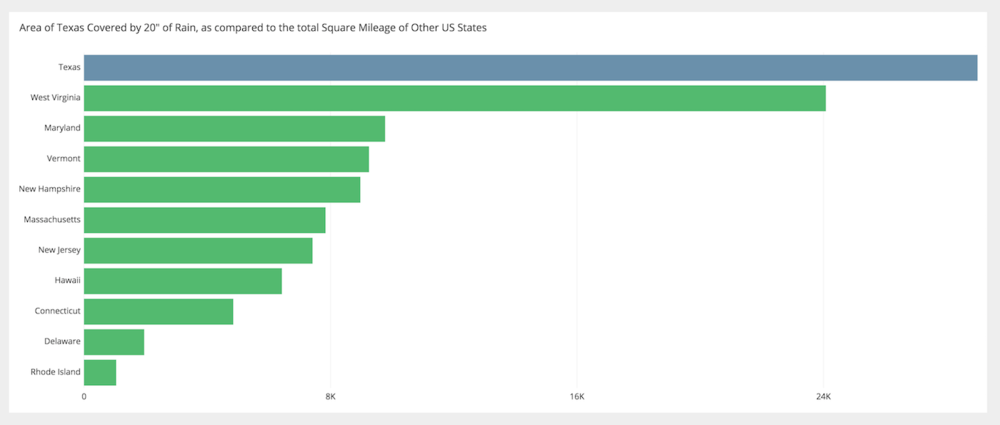
Hurricane Harvey was a large and wet storm— in August of 2017 it essentially parked itself over southeast Texas and dumped so much rain that over 29,000 square miles of area was covered by over 20 inches of rain. When compared to the total square mileage of entire states in the US, that area was bigger than 10 states including very populated areas like Maryland, New Jersey and Massachusetts.
Hurricanes are awesome, and not in the good way, instead in the “inspiring great apprehension or fear” way. I hope that some of the data I’ve outlined above shows the power, indiscriminate damage and death that these massive storms can bring with them.


