Will 2018 Be a Good Year to Raise Funds?
Posted by on February 2, 2018 Data, Opinion, Education, Data Analytics
Last week our partner Snowflake Computing made a big splash. The San Mateo based data warehousing company announced it was adding $263 million in funding to bring its total to $473 million since its founding in 2012. One of our customers, Wag, also recently locked up an additional $300 million.
So it seems that 2018 is off to a great start fundraising wise, but will it continue?
To investigate; we looked at some historical trends to find out if they tend to indicate whether or not there is VC funding money out there to be won and we can plot these types of indicators against funding money over the same time period then visualize and calculate their correlation.
S&P 500
The Standard & Poor’s 500 Index is a representation of 500 widely held stocks that when weighted by market value can show an index that is thought to be representative of the stock market as a whole. Investopedia says:
The S&P 500 is widely regarded as the most accurate gauge of the performance of large-cap American equities. While the S&P 500 focuses on the large-cap sector of the market, it is considered representative of the entire market because it includes a significant portion of the total value of the market.
Read more: Standard & Poor’s 500 Index (S&P 500)
Knowing that the S&P 500 is one of the most popular of economic indices to be used to understand market performance, we are going to take a dive into the S&P data from Yahoo and funding data from Crunchbase to determine whether or not the S&P is correlated to funding availability.
Once we know the index value and the amount of funding money earned over a given time period we can then use the corr() function in PostgreSQL to calculate the correlation coefficient of the two numbers over the given time period.
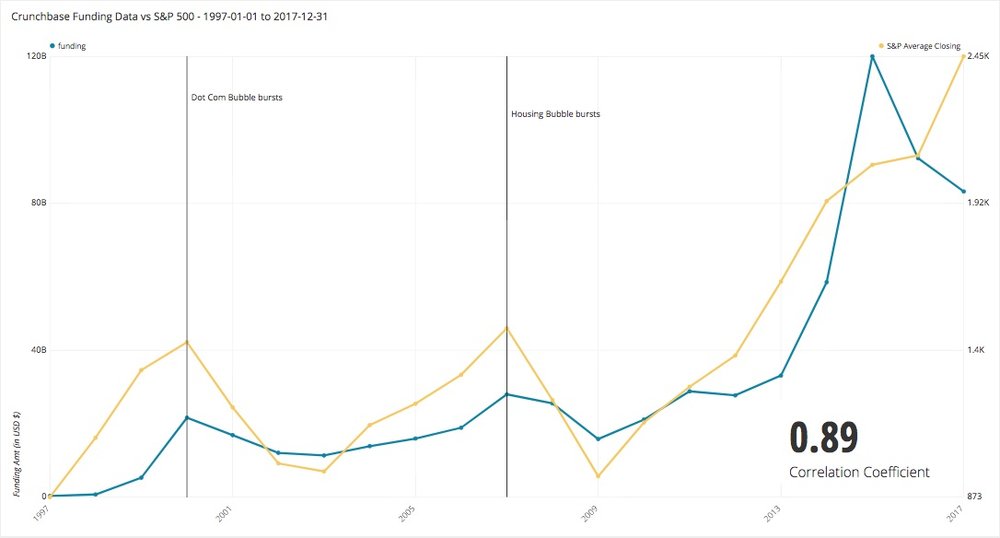
Looking specifically at the time period from 1997 through the end of 2017, you can see that the funding curve follows closely with the slope of the S&P curve. Also, using the corr() function we mentioned above we calculated the correlation between the S&P and funding. Correlation Coefficients are set on a scale of 1 to -1 with 1 being the strongest possible correlation and -1 being the weakest. Basically, 1 is directly correlated and -1 is not correlated at all. We found the correlation to be quite high at .89.
That correlation does not necessarily mean causation is not lost on us, however if you consider the S&P to be a leading indicator, which some experts do, it is possible to assume that the high correlation coefficient of the past 20 years means that a rising S&P can indicate a soon to come rise in funding. The curves show these numbers running together as a visualization of the high correlation coefficient.
Business Confidence Index (BCI) and Consumer Confidence Index (CCI)
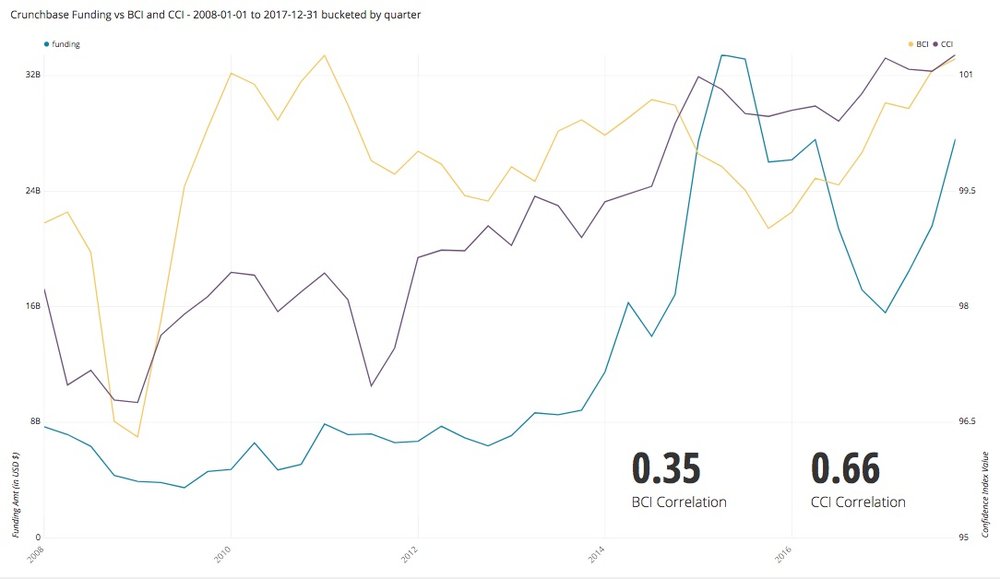
Another pair of valuable indicators are the Business Confidence Index (BCI) and Consumer Confidence Index (CCI). These two indices provide insight into the spending and investing confidence that consumers and businesses have in the market itself. Taking a look at how these two indices track along with the historical record of VC funding for just the last 10 years, it appears as though the BCI and CCI are often one quarter ahead of funding, although not all the time. Both continue to climb, implying a prosperous funding period ahead.
We can break funding down further by round over the last 10 years and take a look at how the S&P, BCI, and CCI Correlation stack up against each other for each funding round from Seed to Series D.
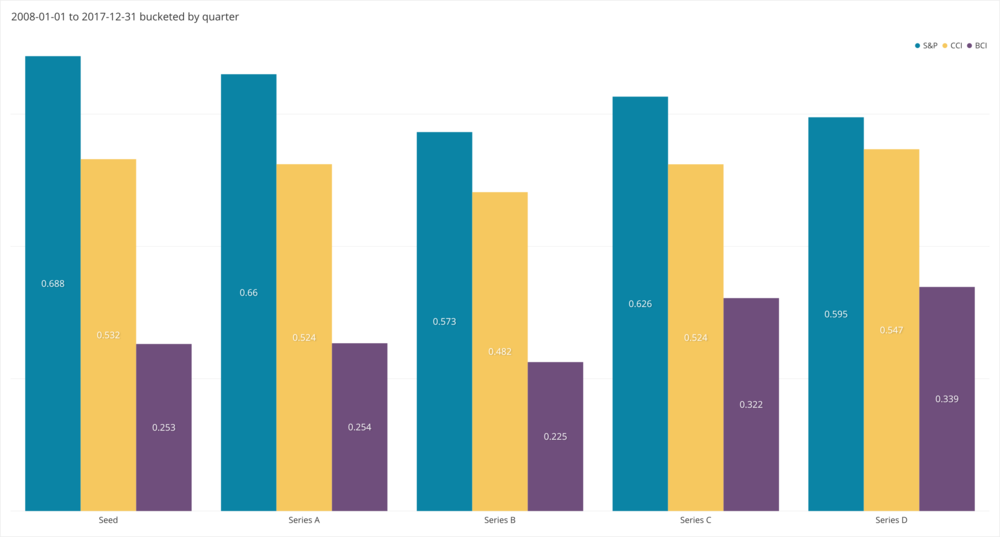
These numbers show that all three of the indices we took into consideration show a positive correlation with funding rounds. The coefficients are all close enough to each other to prove that, by index, the correlation is pretty close to even across the funding rounds analyzed. One interesting note is that Seed rounds are the most closely related to the S&P, while Series D rounds are the most closely related to CCI and BCI.
A safe summary would be that these three indices have historically been closely correlated to how much funding will be dolled out in the near future. Whether or not their relationship is causal as well is up to you to decide. Should you determine that these indices are leading then you can assume that funding will be available in the near term.
Fundraising is more art than science and the most important factors are that you have a great business and a great team. But if you are looking for funding in the near future, you can find some confidence in these strong indicators that you’ll be doing so in a healthy market.
Source: Funding information sourced through Crunchbase via a Crunchbase Pro Account. S&P Data was sourced from Yahoo Finance. Consumer and Business Confidence Index Source.
Methodology: After collecting the data from the various sources, given the possibility of old information and unreliable reporting of funding information some data may be omitted. To measure comparison with American markets, only funding in US Dollars is used in the analysis. The funding period analyzed is January 1, 1997 through December 31, 2017, and January 1, 2008 through December 31, 2017.
Funding Type is kept to Seed, Series A, B, C, and D to keep relative comparison even.


