Every company has data that they can use; those with an online presence even more. Data can be a valuable tool for gauging company health, and in larger companies, data can provide predictions of future performance and suggestions for strategic directions a company can pursue.
Most companies already make use of some amount of data. At the very least, automated reports from applications like Salesforce, HubSpot, Marketo, or NetSuite inform companies of summaries of things like overall spending and revenue, lead generation, sales activities, and customer health. These summaries, however, can be lacking in specific details, and there can be significant amounts of time between reports. Even if details are included, the data might not be provided in a format that allows for easy analysis across time. Creating new reports via combining data living in separate applications can be extremely difficult. Inspection of manually-exported data through spreadsheet programs like Excel can be repetitive and time-consuming. In addition, different teams and functions in the company might have different levels of access to data and therefore siloed views, metrics or reports. If a company is going to get ahead, they’re going to eventually want to build a system that allows them to look at vital metrics at their own pace, to combine data from multiple sources, and to be able to quickly dig into the deeper details for a better understanding of why they are as they are.
What that company wants is an analytics data stack. An analytics data stack is a set of tools that takes data through a processing pipeline, starting from one or more raw data sources, and ending with well-organized, aggregated data that can be analyzed and reported on. In this article, we will go through a general overview of the components that comprise an analytics data stack.
Keywords and Components
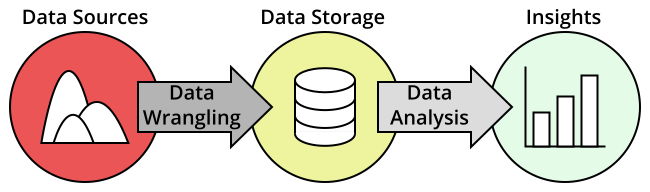
The end-to-end process of going from one or more raw data sources to well-organized aggregated data that generates insights is the data pipeline. The tools that you use to take the data through this processing pipeline is the analytics data stack.
While each company will require a different specific pipeline organization to suit their needs, there are still some major commonalities in terms of the general components that serve in a pipeline. There are three major problems to solve in the creation of a data pipeline, and there are a variety of tools that can serve in each component.
- Data wrangling: There are a lot of ways that data can be gathered, and even more ways that they can be incomplete, messy or irrelevant. Tools in this space make it easier to manage data sources and clean the recorded data into forms that are more conducive to analysis.</p></li>
- Data storage: The cleaned data needs to be stored somewhere so that it can be referenced later on for analysis. Depending on the size of an organization and how much of the original data is considered important enough to keep, the kind of storage architecture to employ can change greatly.
- Data analysis: The data you’ve collected don’t mean anything unless you’re able to draw insights from them. Tools at this point of the pipeline help with further aggregation and summarization of the data along with creation of visualizations that can demonstrate outcomes at a glance.
We’ll go into more detail on each of these categories in the sections below.
Data Wrangling
There are a variety of data sources that any company can make use of. Digital storefronts will record when purchases were made and what items were purchased. Cookies can track user behavior patterns, such as what pages they visit or whether or not they abandon orders after placing items in a cart. Applications that generate summary reports draw these reports from event records. These massive streams of data aren’t particularly useful on their raw forms. Connections need to be drawn between individual events, and connections aggregated into more meaningful patterns. To aid in this wrangling process, there are many tools available to help bring in the raw data from these various sources, clean them up, and perform the basic processing to ready them for insertion into a data store. Traditionally, data wrangling has been known to usually be the most time-consuming part of the data pipeline, and the solutions available in this stage can greatly expedite and streamline the job of making data available for useful manipulation and analysis.
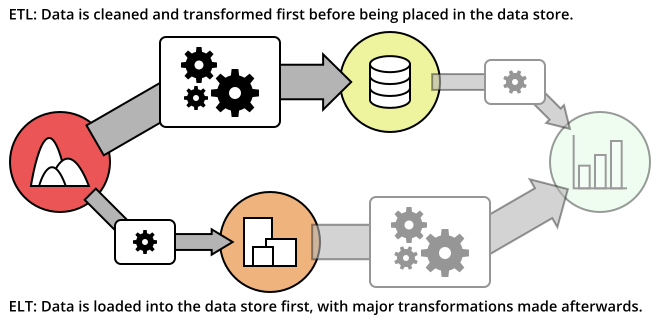
Often times, these tools are often characterized as implementing an ETL process, standing for Extract, Transform, and Load. In the “Extract” step, data must be drawn in from some source, such as signals from web tracking data, or raw transaction data stored in a database log. Next, the raw data needs to be “Transform”ed into a more useful form, such as aggregating the number of page views in each hour, or computing daily revenues. Finally, “Load” refers to the insertion of the data in your data store and the planning surrounding it, such as deciding on the format of the data to be inserted, and the frequency of updates.
A contrasting process that has come about with the advent of massive data storage providers is ELT, or Extract, Load, Transform. In an ETL model, raw data is stored separately from the transformed data built for analysis. With ELT, the “load” step comes immediately after extraction. This allows for the raw data to be available for a wider variety of analyses, but presents additional challenges for the “transform” step, due to the need for processing the larger volume of data after it is in the data store.
Both of these approaches shouldn’t be taken as strict methods for handling data in a pipeline. There might even be multiple stages of transformation and loading as data gets refined further into forms that are useful to specific teams. This line of discussion leads naturally to considerations of the next major part of the data stack: data storage.
Data Storage
Once data has been aggregated, they should be stored for further analysis. It would be too costly to have to start from completely raw data every time an analysis needed to be performed: a data storage provides a home for historic data to be maintained and added to over time.
If there were only one role for data and a single team to make use of it, the data could be stored in a single table, like in a spreadsheet. This is generally unwise and shortsighted: each team at an organization can make use of data in different ways, and they’ll usually be interested in different parts of the whole data that an organization can collect. The first step up from a single table is to divide information into multiple connected tables, or a database. You might have one central table that reports purchases, but identifies users only by ID values. Specific user information would be stored in a separate table, connected by the user IDs. In this way, space is saved by removing information that would have been repeated and redundant if it were part of a central store.
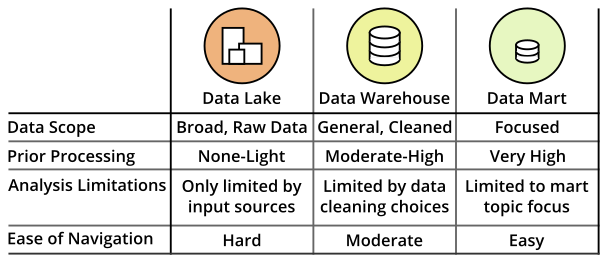
One of the most common ways in which data is stored for an organization is in a data warehouse. The data warehouse will house all of the databases that serve as a complete source for all useful data for performing analyses. A data warehouse might also be divided into smaller components rather than just being a comprehensive whole. Different teams in an organization may be interested in only specific parts of the data. Data marts are subsets of the data warehouse to serve these specific teams. Since the data in these marts are more focused than the full warehouse, it can make it easier for individual teams to extract insights that they care about.
A key aspect of the data warehouse is that the data stored there is structured for performing analyses. If you want the raw data to be stored alongside processed data, such as through an ELT process, you can retain them in a data lake. Data lakes stand in stark contrast to data marts, being broad stores of general data rather than highly curated data collections. The benefit of a lake being so wide is that it is easier to spin up new analysis ideas, at the cost of being more difficult to navigate.
Data Analysis
While there might be some individuals out there who are able to look at a table of numbers and get a good intuition for what they say, for most people, interpreting data will usually require the use of visualizations and reports. If a data scientist has access to the data store, they could programmatically query and summarize the data to generate these visualizations.
Furthermore, they could also set up a system to automatically generate reports to be sent out on a weekly basis, or perhaps viewed in a dedicated location with a daily update. But this means that if any questions are generated from the reports, it requires sending those questions back to an analyst to perform the drill-down. This can be a negative, as it takes time away from an analyst or scientist’s other duties, and the cycles of question and answer can take some time to resolve. It would be much better if a report reader could take the initiative to answer those questions for themselves.
This is where tools on the data analysis step of the pipeline come in. Business intelligence (BI) tools can help to bridge the accessibility gap between data and outcomes for those with less technical expertise. While a data scientist might still need to set up the way that a BI tool draws data from the data stores, once set up, a good tool can allow others to then draw insights without technical aid. BI tools can also go beyond the power of individual visualizations with the creation of dashboards. Dashboards are collections of visualizations, tables, and summary statistics that can act as on-demand reports. Interactive dashboards go one step further, including places where viewers can filter data by features like group and date, to isolate interesting trends without the need for outside help.
Final Thoughts
For a company to become more data driven and more informed, building an analytics data stack can be a major boon. Data wrangling tools can convert masses of data into cleaned, aggregated forms that can generate insights. A data storage solution is vital for keeping track of metrics over time, and for organizing data so that it is easily analyzable. Finally, data analysis tools convert numeric values into more tractable visualizations and dashboards to answer existing questions and bring forth new ones.
Moving from automated and siloed reports to a data stack is a major task, since there may be a lot of new components to bring online. Each segment of the pipeline has numerous competing tools, and it is important to choose components that fit the size and readiness of the company that they will be attached to. While certain applications will demand relatively little intervention from users, others might require a dedicated hand to help maintain the efficiency or usability of the tool or application employed.
It is also important to make sure that there is a good matchup between data wrangling, storage, and analysis. Fortunately, many tools will note partnerships or integrations to make moving from step to step easier to make setting up a data stack as low-friction as possible. Even Google and Amazon, which have comprehensive and broad-reaching ecosystems, are also interested in partnerships and integrations with other data tools. This level of modularity also has some additional benefits, in that it can be possible to change tools as a company’s needs change. Still, it’s a good idea to try and get things planned out right from the start, as changes can still be costly, especially on the storage stage of the stack.
Additional Articles
Learn more about the components of the data stack with these Chartio articles: