Using the Correlation Function in PostgreSQL
One function that can be useful in determining how two numbers relate to each other is the correlation function.
In this tutorial we will explain the corr() PostrgreSQL function as well as show it in real world use.
The Correlation Coefficient is a widely used method of determining the strength of the relationship between two numbers or two sets of numbers. This coefficient is calculated as a number between -1 and 1. 1 being the strongest possible positive correlation and -1 being the strongest possible negative correlation.
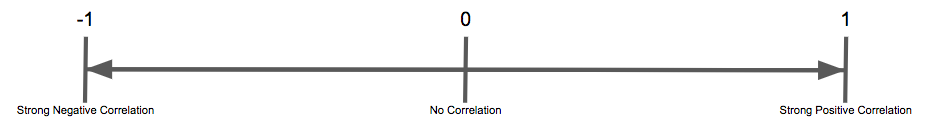
A positive correlation means that as one number increases the second number will also increase.
A negative correlation means that as one number increases the second number decreases.
Whether or not the outcome of the second number is CAUSED by the first is not being determined here, just that the outcomes of the two numbers happen in concert with each other.
If the formula returns 0 then there is absolutely NO correlation between the two sets of numbers.
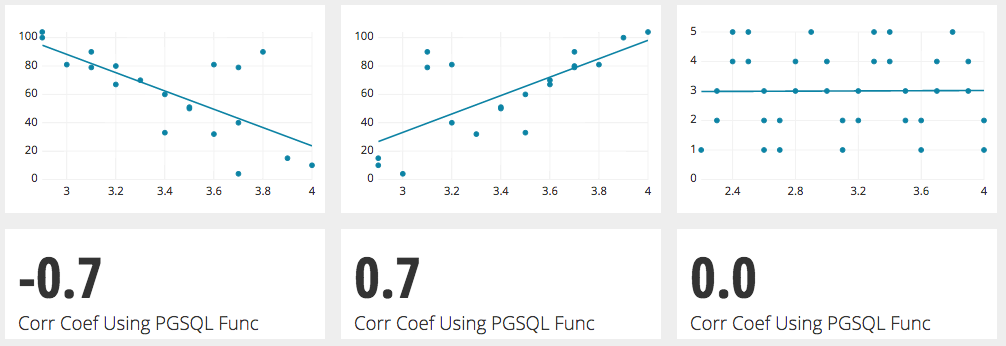
In an example where the correlation coefficient is .7, for every increase of 1 of the number on the x axis the number on the y axis increases by .7.
The larger the number is, the stronger the correlation is. Whether or not it is preceded by the “-“ sign doesn’t matter.
One of the most popular correlation coefficients is the Pearson Correlation Coefficient, and more information can be found in another tutorial here.
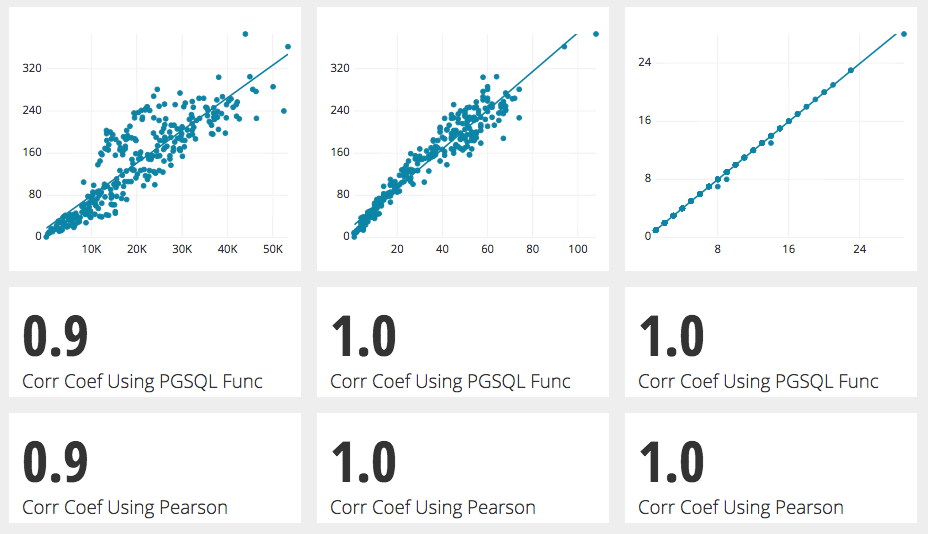
After we ran a few tests on the postgresql correlation function, it came up equal to the calculation of the Pearson Correlation Coefficient all three times.
While using the PostgreSQL Function the important note is that it is an aggregation function. That means it will calculate the correlation of the entireties of two series of numbers. It will not display the correlation of two numbers within the series.
Using the correlation function already in postgres is pretty straightforward.
We used it as an aggregate function of two series of numbers to determine the correlation coefficient over a series of time of website activities and revenue in a Chartio Demo Source we have on our site.
Plotting these two measurements on a scatter plot, a pattern of positive correlation emerges. Using the correlation coefficient PostgreSQL function shows a result of 0.9 which is an almost direct correlation.
That query looks like this:
    SELECT
        corr("Amount", "Activities") as "Corr Coef Using PGSQL Func"

    FROM(
    SELECT
        DATE_TRUNC('day', p.payment_date)::DATE AS "Day",
        SUM(p.amount) AS "Amount",
        COUNT(DISTINCT a.activity_id) AS "Activities"
    FROM
        public.payments p
        INNER JOIN public.subscriptions s ON p.subscription_id = s.subscription_id
        INNER JOIN public.users u ON s.user_id = u.user_id
        INNER JOIN public.activity a ON a.user_id = u.user_id

    GROUP BY 1) as a
In this particular case you will need to use the aggregation function of the metrics gathered in a subquery. This is very straightforward, just add the two columns you are trying to determine the correlation of in between the parentheses separated by a column and your output will be the correlation coefficient as calculated by the aggregation function which as we point out in the following tutorial is almost exactly the same as the Pearson Formula.