Comparing data from two different data sources is something that would normally need a lot of different moving parts especially if you are interested in creating some visualization on that new data.
In Chartio’s SQL Mode, as in most SQL editors, you can write this type of join and connect these two tables IF they are in the same data source. Using the schema editor you can dictate how two such tables would be joined in the Interactive Mode, that is IF they are in the same data source. You cannot do this with two disparate and separate data sources. That is where Chartio’s Layering comes in.
How SQL Can Create a Join
In SQL syntax the joining of two tables happens in the FROM clause and the command is very simply JOIN. Syntactically, it looks something like this:
_SELECT p.id, p.name, p.city, p.state, s.score_
_FROM public.person_info as p_
_INNER JOIN public.score_info as s ON p.id = s.id_
- What we have done here is taken these two tables:
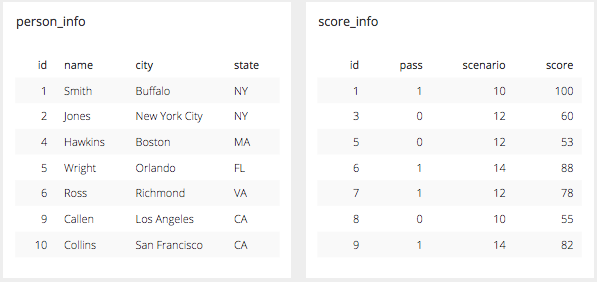
- And literally joined them together to be one table with the results of where the two tables intersect on the “id” column.
- The Join can be explained with this animation
- The resultant table is a combination of the two and looks like this:
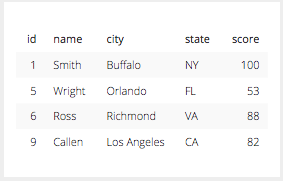
As you can see with the animation and the resultant table above the items return by the INNER JOIN shows rows ONLY where the ID is in BOTH tables with the specific columns mentioned in the SELECT clause. That is the crux of JOINS in SQL: bring me data from multiple tables where a column that exists in both tables intersect. This is the most basic form of JOIN the INNER JOIN. There are different ways that these tables can be joined, or different join types, and those can be explained using venn diagrams like the ones that appear below.

How Chartio Layers Create Joins
In Chartio’s Interactive Mode you can join two sources together with Layers. The basics are pretty simple here, you just need to follow a few steps to set up the underlying queries to establish the two tables that are to be joined. How the layers do joins is pretty similar to how Excel might use the VLOOKUP Function. By selecting a merge layers data pipeline step (in the Interactive Mode this is done by adding a new layer by clicking the plus “+” sign under the data explorer) you are telling Chartio to take the tables that result from the initial queries in the specific syntax of the specific data sources and merge them on the intersecting rows in the columns selected.
The difference here is that in the interactive mode in Chartio you are dictating that these columns are to join on the first 1, 2, 3, etc columns on the left of the the two tables, similar to Excel’s VLOOKUP. As opposed to joining in SQL Mode where you can dictate the column in the typed syntax.
In Chartio, the Layering option can join two distinct data sources, either from two different Amazon Redshift connections or PostgreSQL connections or even joining and comparing Google Analytics with an Amazon Redshift source or another type of data source. In this example we will compare an Amazon Redshift Source in Chartio with a Google Analytics source that we use to monitor page view sessions. So let’s compare sessions with Leads from the Salesforce Lead Table.
- Step 1: Build the query for the Amazon Redshift Source.
- REDSHIFT - Salesforce Layer
- Table - SF Lead
- Columns
- Count of Distinct Id
- Day of Createddate
- Createddate last N weeks 1

- REDSHIFT - Salesforce Layer
-
Step 2: Set up the join step, by adding a new layer.
- Step 3: Build the query for the Google Analytics Source.
- GOOGLE ANALYTICS - Chartio Web Analytics
- Table - Session
- Columns
- # Sessions
- Day of Visit
- Time Last N weeks 1

- GOOGLE ANALYTICS - Chartio Web Analytics
- Step 4: Use Data Pipeline Steps to manipulate the resulting joined table
- Add Column
- New Column Type
- Leads - Running Total
- Formula Type
- Running total
- Using Column
- Count of distinct id
- New Column Type

- Add Column
- New Column Type
- Sessions - Running Total
- Formula Type
- Running total
- Using Column
- Ga:sessions
- New Column Type

- Hide Columns
- Count of distinct id
- Ga:sessions

- Add Column