A Better SQL IDE
Posted by on September 10, 2020 Chartio
Few people know this, but the original name of Chartio was actually SQLcharts.com. It was intended to be a simple product: type SQL, get charts.
But our founder Dave Fowler soon became passionate about a bigger mission — enabling anyone, not just people who know SQL, to explore and understand data. Having “SQL” in our name suddenly felt too limiting, and we changed it to “Chartio” just before launch.
Still, that ability to simply enter SQL to create charts has remained a core functionality of our product. SQL is the language of data, and therefore the most flexible, powerful way to work with it. We love SQL, and evangelize and teach it wherever possible: see our interactive SQL tutorial, or our book on how to teach people SQL.
Earlier this year, we released Visual SQL, our innovative interface and language built on top of SQL that enables anyone to more quickly query data. After that release, we decided to revisit our SQL editor as well. Because no matter how great our visual version of SQL becomes, we know many users will still want to dive under the hood to edit a query, or to start a new one from scratch.
Many customers have told us that, for a variety of reasons, they use other SQL IDEs to create their queries, which they then copy and paste into Chartio. We wanted to enable more of that workflow inside of Chartio, so we’ve been working hard to deliver on many of the top-requested features for those users who live in SQL.
Today, we’re happy to announce a slate of improvements we’ve rolled out to make our SQL Mode more functional, responsive, and user-friendly than ever before.
SQL history
For most users, exploring data is an iterative process. You build a query, view the results, refine, and repeat, in an ongoing quest to glean the best possible insights from your data.
With all that experimentation, it’s reassuring to know that any changes you or your teammates make to your queries can be reverted to earlier versions, so you never have to worry about straying too far down the wrong path.
That’s the thinking behind our new and improved SQL history feature. You’ll now notice a history icon in the bottom taskbar under the SQL Mode editor. When you click it, we’ll display a history pane with a log of recent edits to your SQL queries:
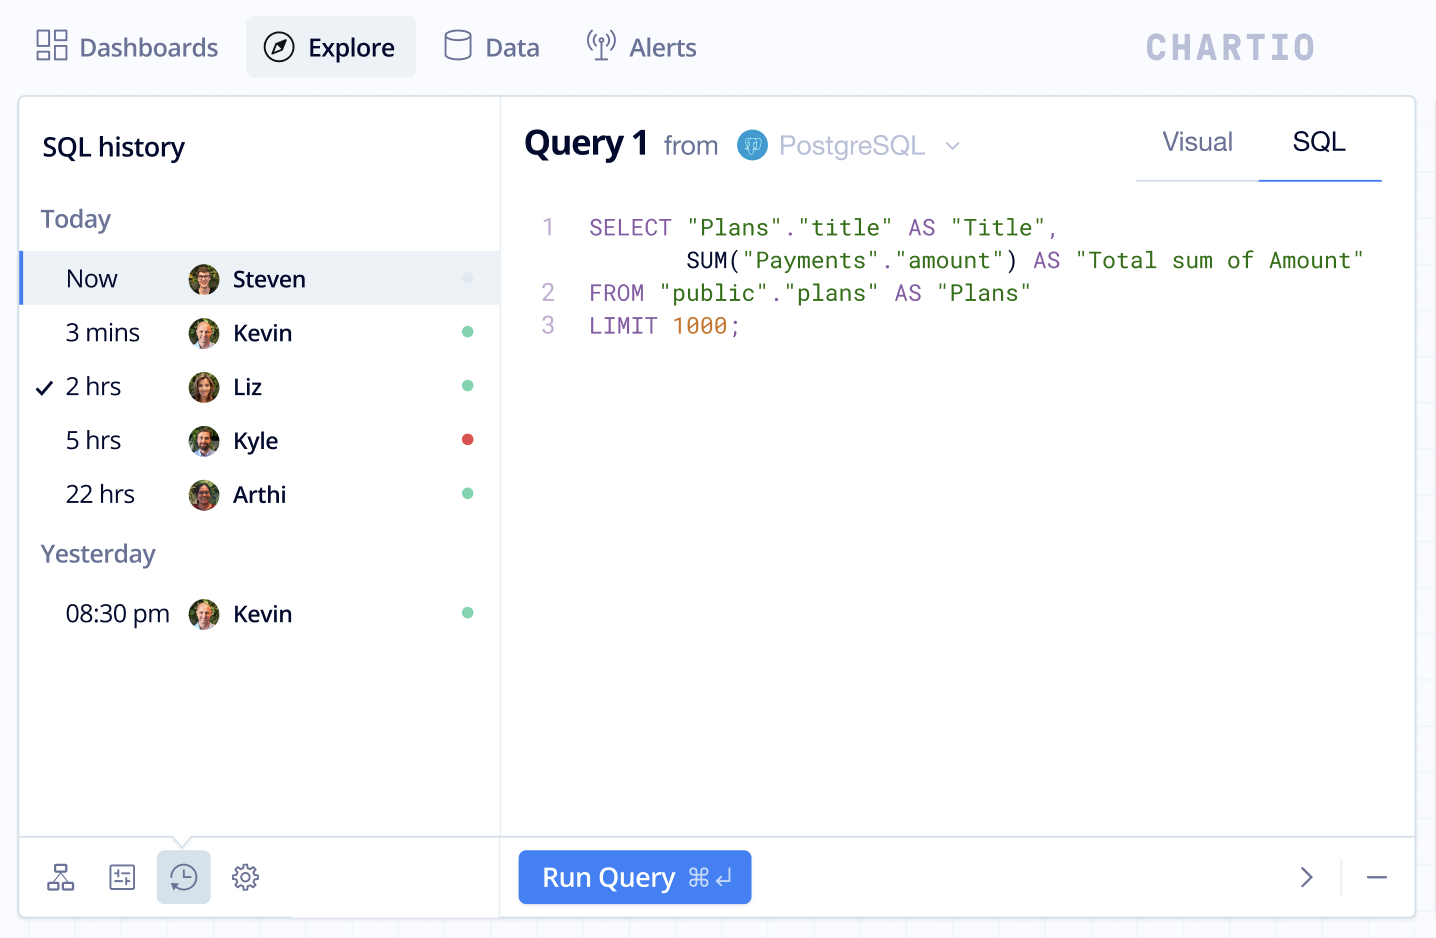
We save a history item for every query execution and list them in reverse chronological order, with details on who ran them and if they were successfully executed. That way, you can review your teammates’ work, pinpoint any issues that they may have introduced, and collaborate more effectively as an organization.
The SQL history pane is also great for experimentation, giving you the ability to try out new queries and revert back to earlier versions as needed. And if you’re building a particularly large query out of several smaller ones, the SQL history feature lets you toggle between your subqueries, so you can more easily keep track of your entire query and refine it as it grows.
3x more space for editing SQL
We’ve worked hard to make Chartio’s interface as clean and streamlined as possible, while still giving you access to all our main features in one place. But let’s face it – when you’re building queries, sometimes you just want to tune everything else out and get down to the business of writing SQL.
That’s why we now give you three different size options for your SQL Mode editor. You can work in our standard mode, which is now larger by default, or you can hide the left drawer for even more real estate. You can even expand the editor to utilize almost the entire window, giving you maximum room for editing your queries.
Auto auto-complete
Anyone who regularly works in code knows the value of auto-complete.
Instead of having to type out lengthy, easily-misspelled text for common elements — like long table and column names — auto-complete lets you enter just a few characters and have the likely ending suggested for you. This may seem like a minor enhancement, but when you’re working in SQL all day long, those seconds can definitely add up. And auto-complete is especially useful if, like most people, you haven’t quite memorized SQL’s extensive list of standard keywords.
We wanted to make this auto-complete feature even more helpful for Chartio users. So, as you’re typing in SQL Mode, you’ll now notice our enhanced auto-complete functionality. An expanded set of common keywords will be suggested as you type, helping you write your queries more quickly and efficiently.
And if at any time you want to turn off the auto-complete feature, you can now easily disable it in your settings.
Better look, better performance
We’ve learned from our users that the design and aesthetics of our editor matter a lot, even for engineers and analysts who may not be used to great-looking interfaces. So, we’ve upgraded the fonts and colors of our editor to be more appealing and user-friendly.
We’ve also improved our SQL editor’s scrolling and responsiveness, and eliminated performance lagginess when typing, for a smoother overall editing experience.
And SQL Mode responds to a handful of convenient keyboard shortcuts, helping you save time with common tasks like running and formatting your SQL queries.
Finally, when it comes to the ideal look and feel of an IDE, every user is unique: some some prefer dark mode, some prefer vibrant colors, while others prefer no color at all. So we’ve not only modernized the style of our SQL editor, but we now enable themes as well, giving you greater power to customize your editing experience.
New variables panel
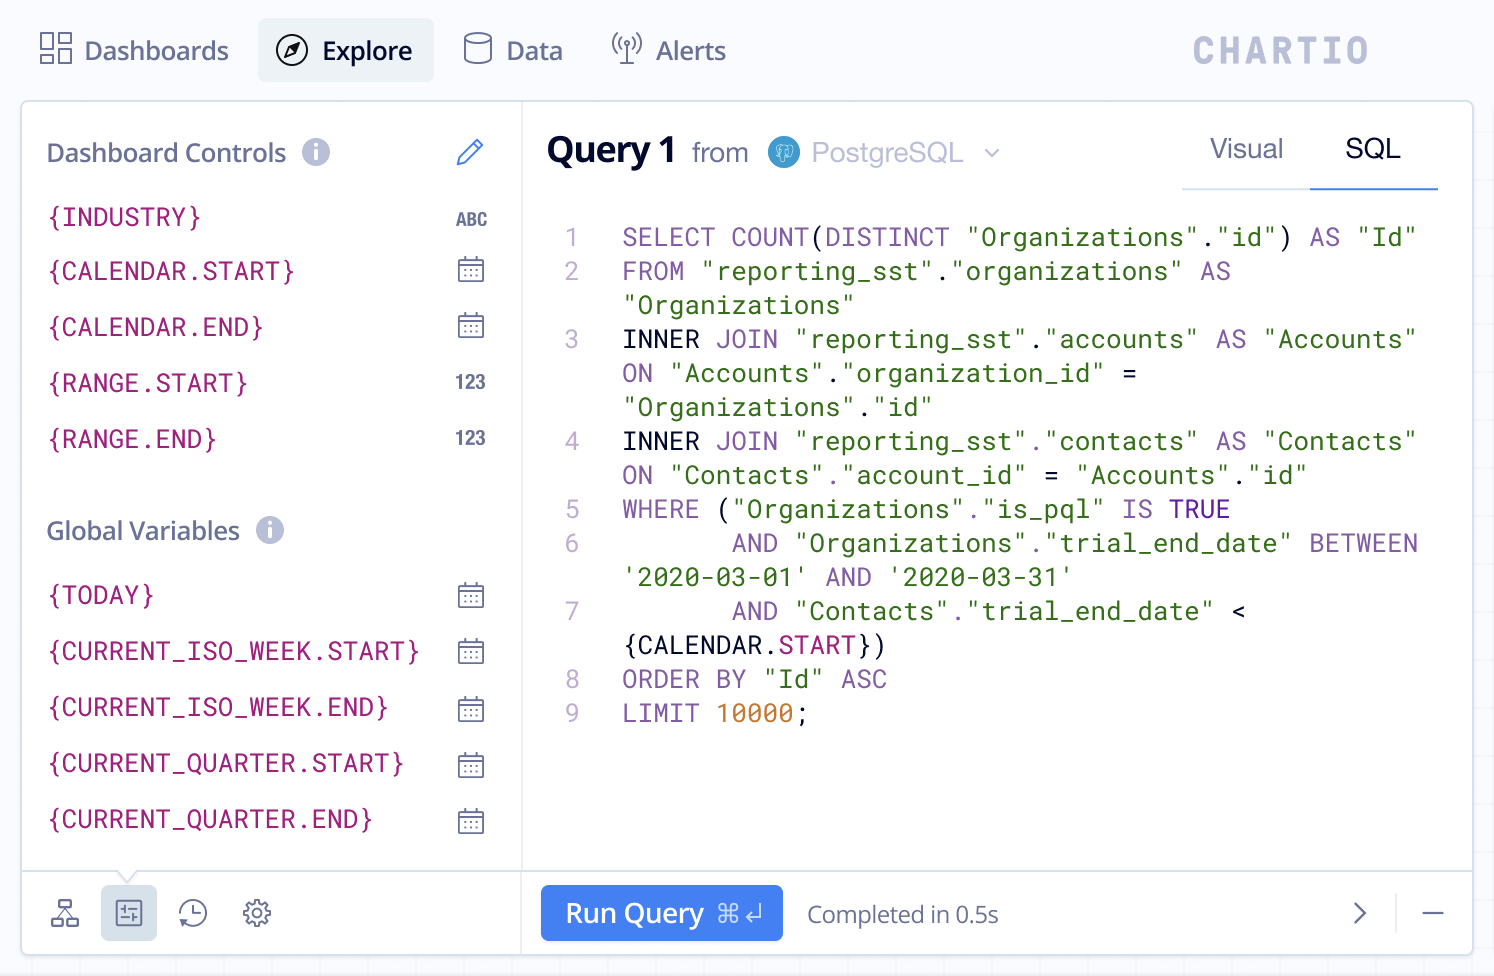
If you’ve set up variables or dashboard controls to use in your queries, we’ll now list all of them — even global variables — to the left for easy reference:
Clearer, less intrusive error messaging
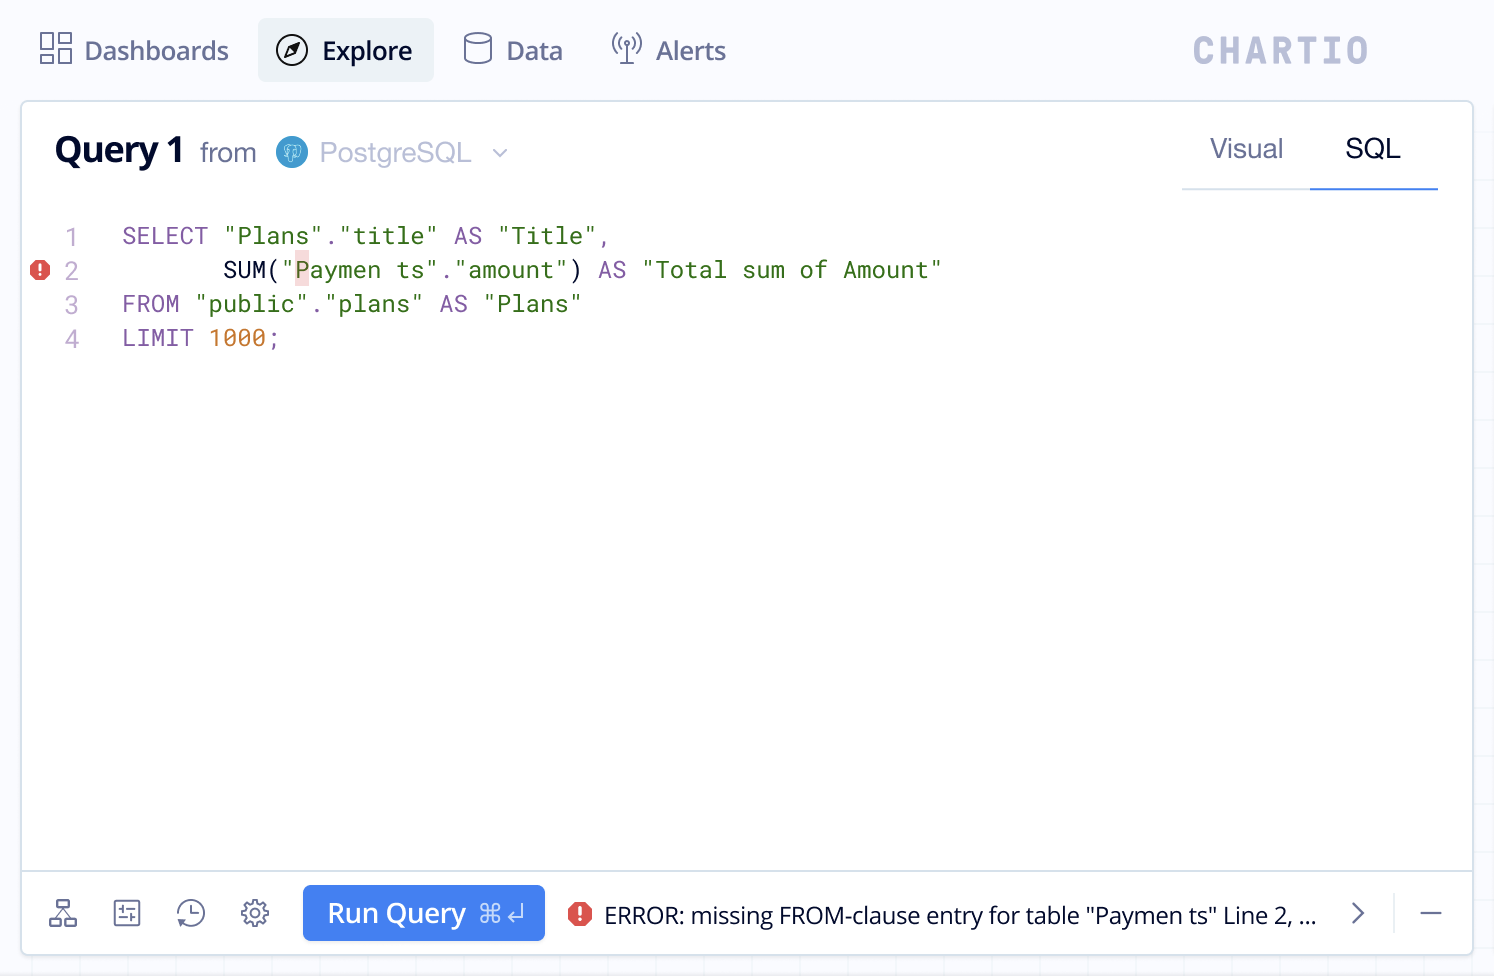
Until now, we’ve displayed an error message every time there’s a syntax error in your queries, and highlighted the problematic section of your query in red. While these alerts were meant to be helpful, we realize that too-frequent error messages can become more irritating than the errors themselves!

So, we’ve completely gotten rid of the “toaster”-style error alerts (yes, they’re all gone!). Instead, we now simply highlight where the error has occurred, and move your cursor automatically to that area. We also note the exact line and column of your error, so you can more easily resolve it.
Always-On Result Table and Pipeline
The new SQL editor also greatly leverages the work we did for Visual SQL.
For example, we learned from our research into IDEs that a large area for showing result sets was key. So, we designed a new Result Table into Visual SQL, and it works great with our new SQL IDE as well. From the Result Table, you can easily perform transformations — like pivoting data, sorting columns, and renaming.
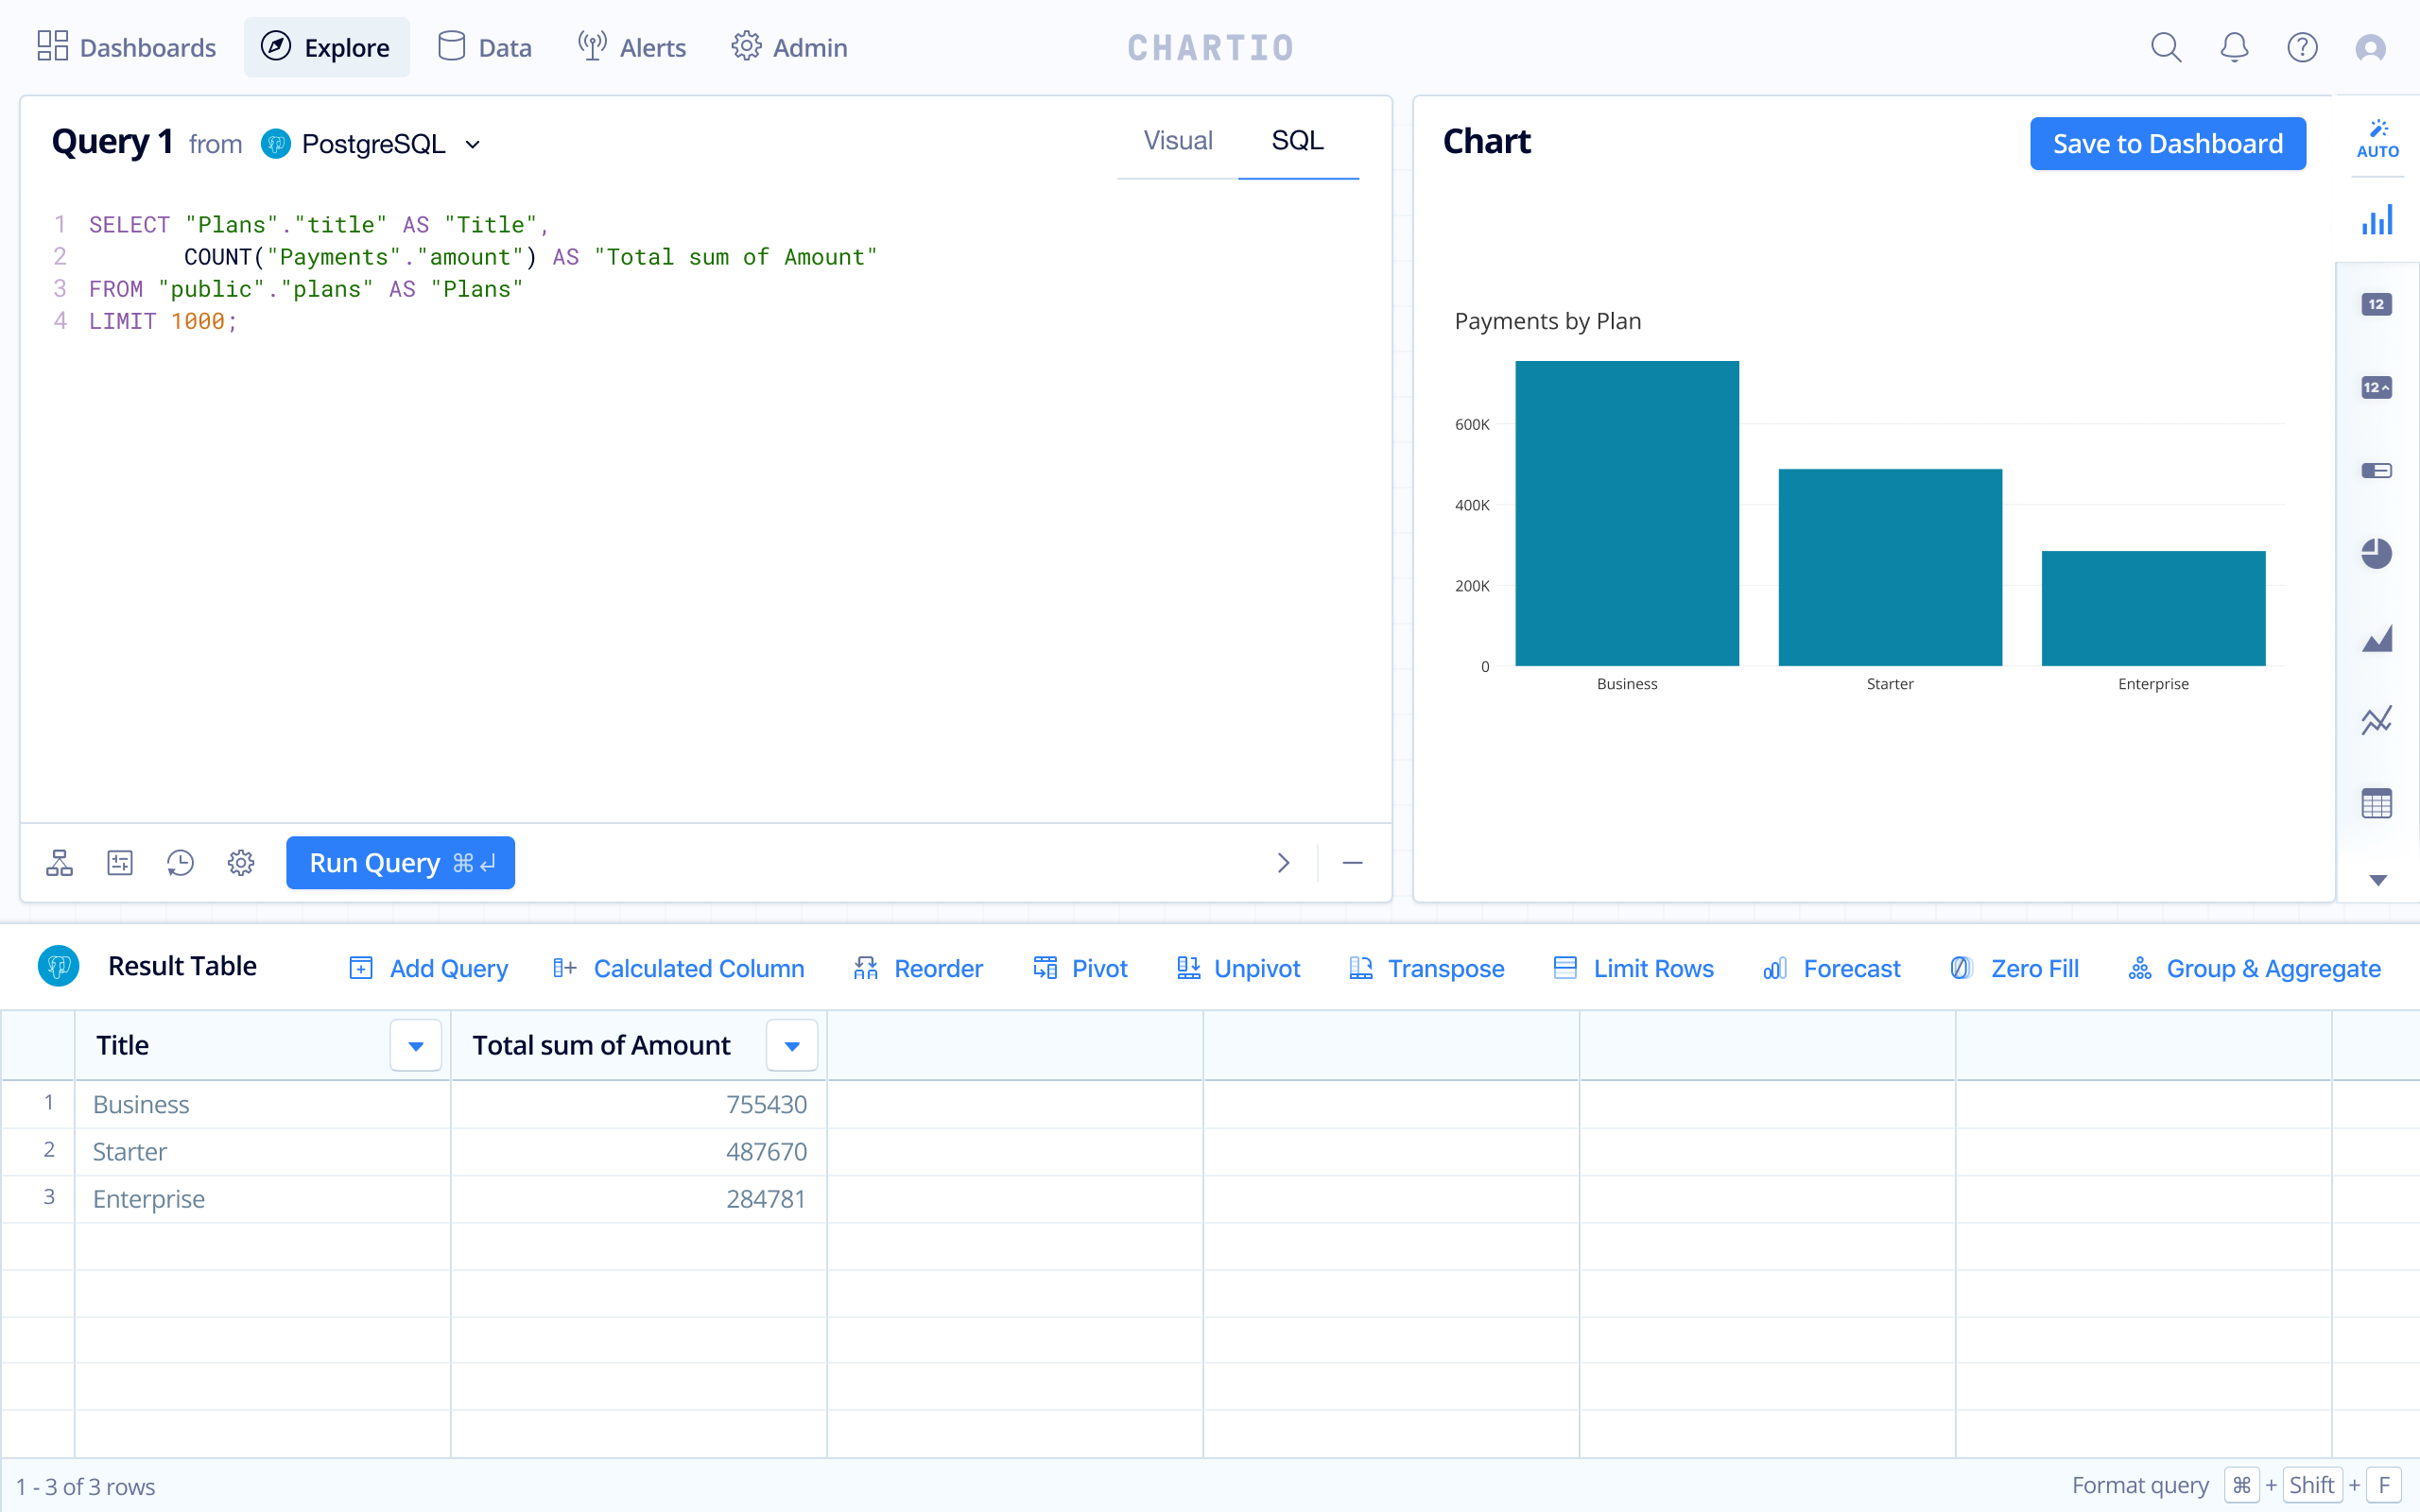
Similarly, the popular Pipeline feature that we developed along with Visual SQL is equally robust with SQL Mode. With each transformation you perform on your query results, a new step is added to the Pipeline, so you can quickly review all the actions you’ve taken and better understand how you arrived at your final output.
Finally, if you find yourself using the SQL editor as your primary query-building interface, you can now set SQL Mode as your default, saving you a step every time you fire up Chartio.
The new and improved SQL Mode is now available for all Chartio users, so sign up or log in to give it a try today.
Also, if you’re a user and have feedback for us, please drop us a note — we’d love to hear from you. And if you’re a designer or PM who’s as obsessed with data as we are, come join us — we’re hiring.


