How Chartio Simplifies the Lambda Architecture for Fast Real-Time Business Intelligence
Posted by on September 3, 2015 Chartio, Data Governance
The Lambda Architecture is a data processing architecture that has been getting a lot of attention lately. By using two parallel systems, we can blend relatively high-latency batch views of large data sets with small, low-latency real-time data sets.
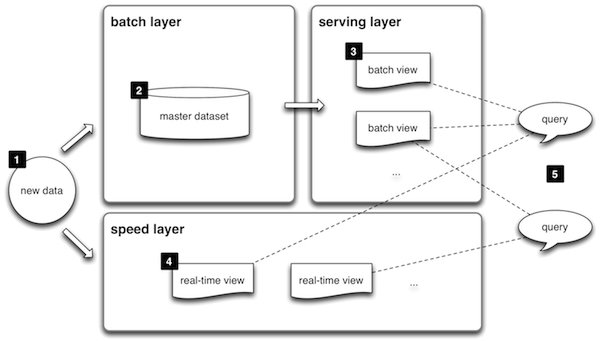
The Lambda Architecture combines high-latency batch data with low-latency real-time data.
In the Lambda Architecture, data (1) is dispatched to a batch system (2) and a real-time system (4) . The batch system manages the master data set and pre-computes batch views (3). The real-time layer compensates for the high latency of batch updates, processing the most recent data and guaranteeing low latency at the cost of increased complexity.
However, one of the pain points of this architecture arises at query time when we need to find a way to query both systems simultaneously and merge the results. Chartio is an ideal tool for that application.
Chartio was built for the modern era where businesses have data both on-premises and in the cloud. Unlike other BI tools, which force you to invest in expensive ETL processes and lock you into a single monolithic data warehousing technology, Chartio allows you to blend data across a myriad of data sources better supporting polyglot persistence architectures such as the Lambda Architecture.
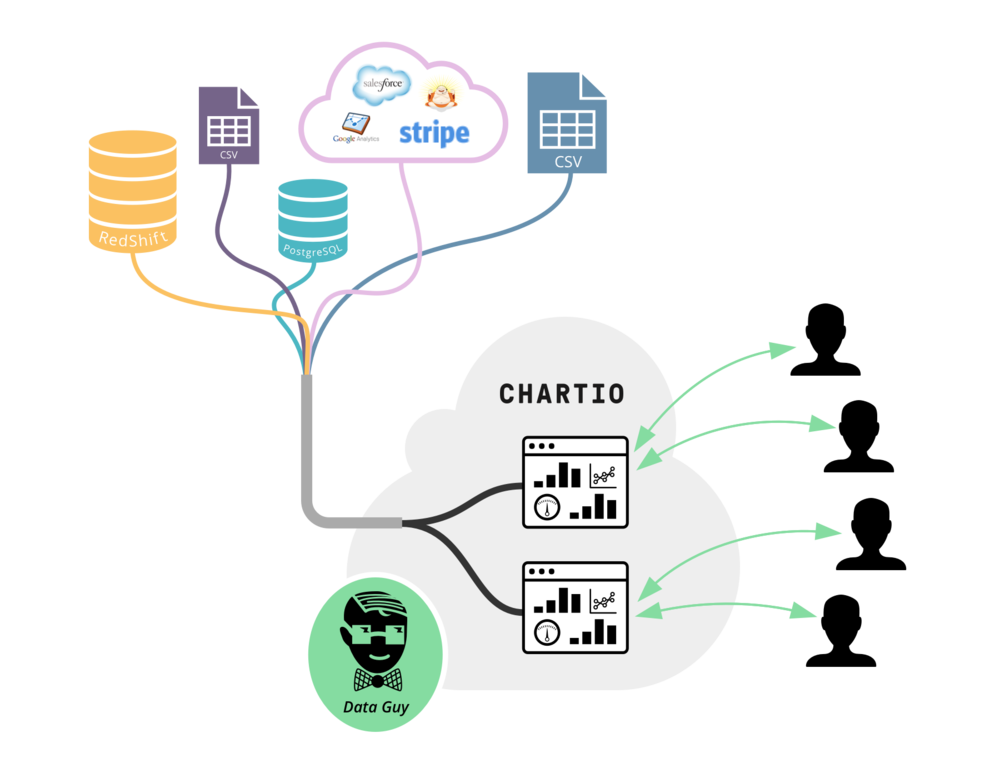
Chartio is designed from the ground up to work with on-premises and cloud data together.
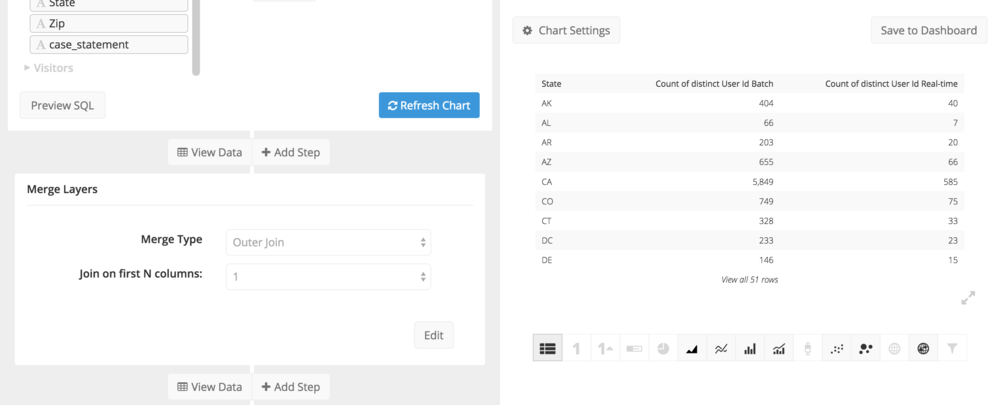
Using Layers, Chartio can seamlessly merge data from disparate distributed data sources. Below, we’ll walk through merging data from Amazon Redshift, which is a cloud data warehouse serving as our batch system, with data from an on-premise in-memory Postgres instance serving as our real-time system.
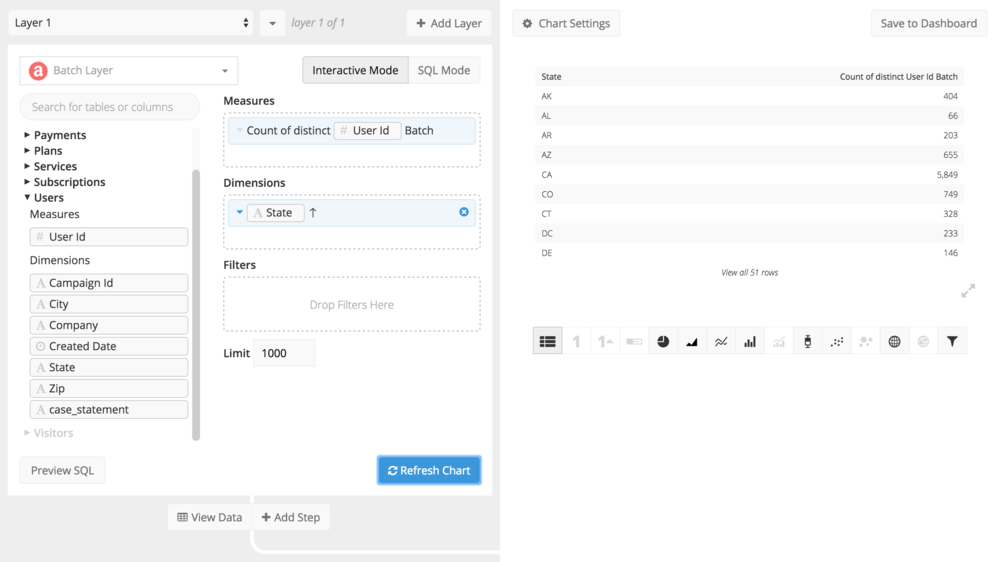
First, we open Chartio’s Chart Creator and get a historical count of users by state from the batch system.
Then, we create a new layer and get a count of users by state for the last few hours from the real-time system.
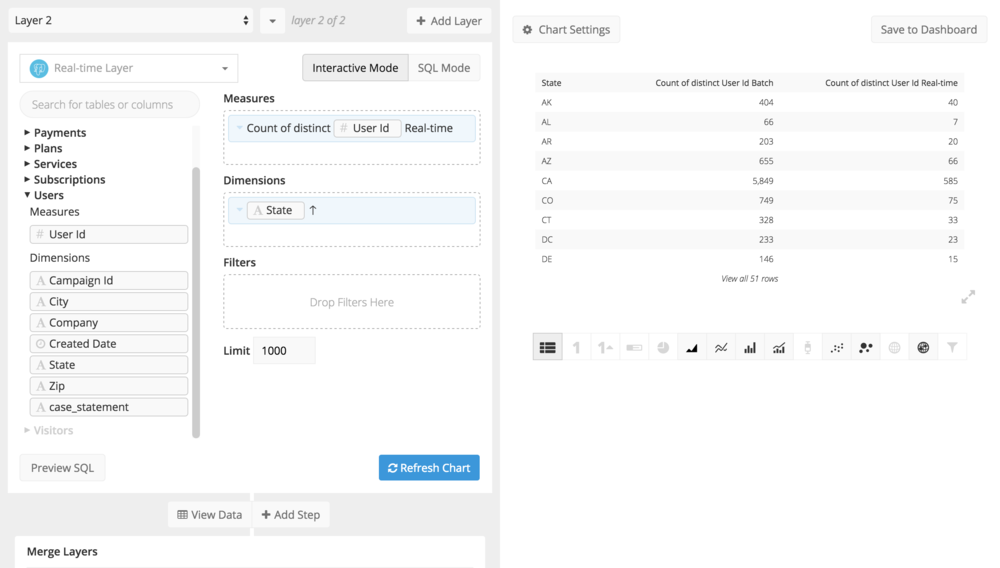
Once we have that, we can choose how we want these two layers to be merged. In this case the default, outer join, is fine.
Finally, we will use the Combine Columns step in the Data Pipeline to arrive at a final number.
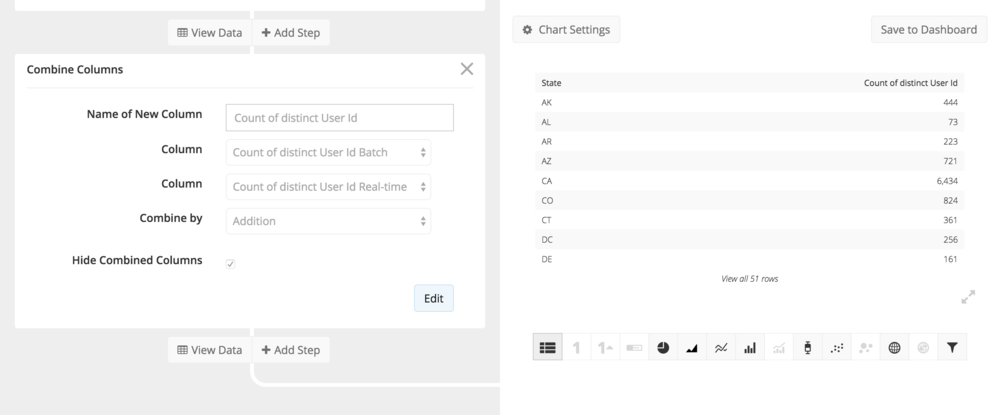
With just a few clicks, we’ve taken advantage of the MPP architecture of Redshift as well as a low-latency Postgres instance where a subset of recent data resides in-memory to get the best of both worlds.
We could also supplement this architecture by using Chartio’s Data Stores to create additional batch views of the data stored on Amazon Redshift to further speed and simplify processing of high-latency data.
This freedom from ETL investment and data warehouse lock-in is one of the major benefits of Chartio’s agile BI offering.


