Getting Fancy with Chartio’s new Advanced Data Pipeline
Posted by on April 13, 2017 Data, Data Analytics, Features
Sometimes data is a little messy, hard to work with or just not pretty. Cleaning up and organizing data can be hard to visualize and painful. But today, we’re excited to announce Chartio’s Advanced Data Pipeline, a powerful drag and drop interface where you can visualize and organize your data.
With the Advanced Data Pipeline, we brought the aspects of the Data Explorer you know and love, and transformed it to do more. Now, visualizing your data workflow is easier, more flexible and you get more power by being able to do multiple merges. So, this all sounds great, but what does it all mean?
A few weeks ago I was tasked with building a report for our Customer Success Managers to help them summarize accounts with a breakdown of customer plans, users and billing information. This seemed easy. That is, if all the data lived in one database with concise tables and data relationships already clearly defined. Unfortunately, reality is less than ideal and the data needed a little help before being report ready.
I needed time to process, think and explore ways I could get this data to work for the report. My first thought was to put pen to paper so I could easily map things out, but that wouldn’t give me results to verify if my process was correct. Next, I moved on to trying things in Chartio. I considered having multiple tabs open to run simultaneous queries, but having to switch between tabs seemed complicated, and I would have to somehow put it all together in the end.
I was at an end in terms of how to get this working effectively. While weighing out my options, a possible solution came to mind: Advanced Data Pipeline. It was something we had released internally to try out initially for a test run to see if it would be worth pursuing as a full feature. I hadn’t taken it seriously since it was something I hadn’t quite understood yet but I thought, why not, this might be the solution.
For this whole thing to work, the Advanced Data Pipeline had to do a couple of things for me:
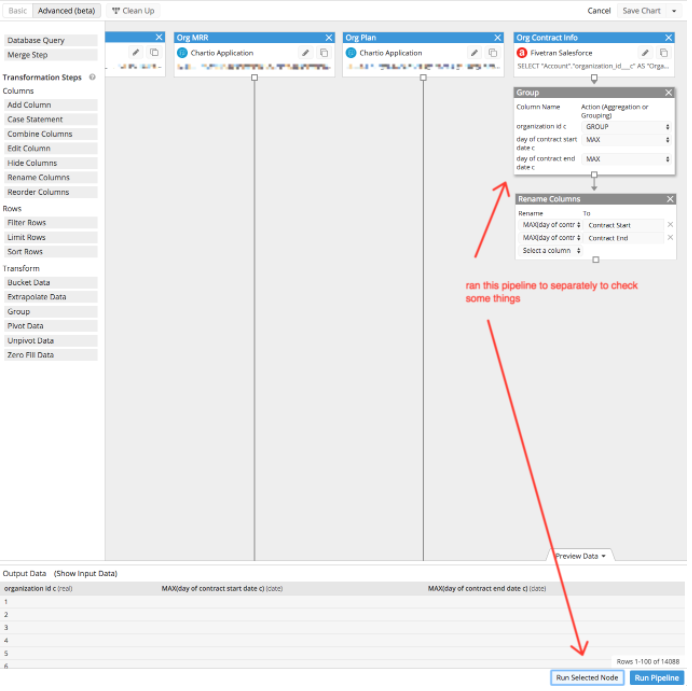
- Let me run as many queries as I want to verify if the query logic does get the result I need
I started off with one layer (node) and built off that. But I would run into a situation where I needed to run a one-off query to verify something or I wanted to test a separate query but I didn’t want to join it to the current data set. - Let me debug my work
I know this is going to be a monster of a chart, so I need a quick and easy way to debug things if something goes wrong. Nothing is worse than seeing an error and you have no idea where it’s coming from. - Let me organize my work, my way
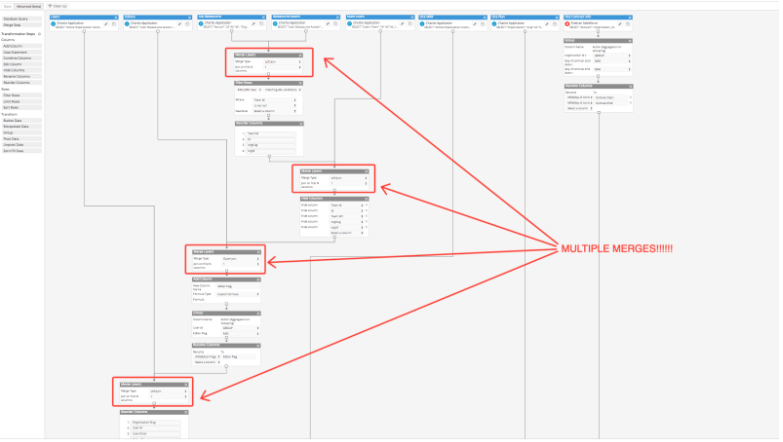
I’m a visual person and I work best if I can visualize things the way I process things. - Let me do more merges!!!
I know that I’m going to need to do different merges between different datasets before getting the final result. For example, layer 1 and 2 need to be joined on a specific column but then I want to merge those results with another layer using another type of join and column.
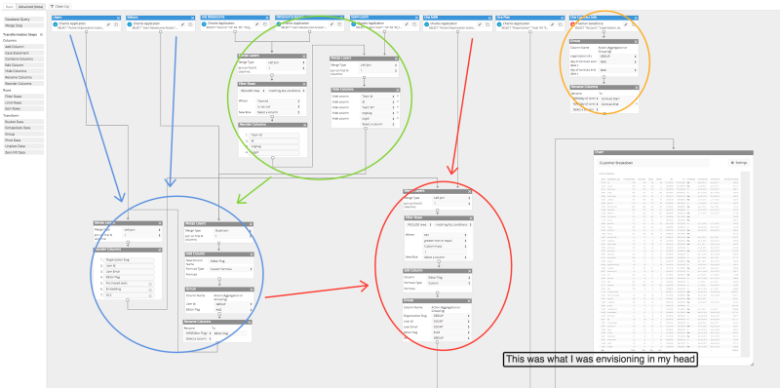
All these things came to me in stages as I was building this report and this is what I came up with:
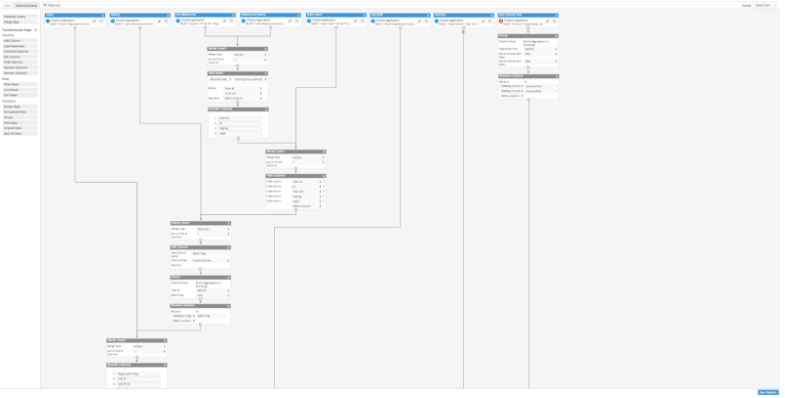
The above image isn’t even the whole thing. There’s about another half page worth of steps to get to the final chart. Although it’s not the prettiest thing, I did get the report! It might look complicated and a bit grandiose, but this pipeline clearly reflects my thought process in creating the right data flow for the final report.
It’s natural when you get a question or problem you’re trying to solve, to break it down to smaller pieces, and I was able to use the Advanced Data Pipeline. The very first thing I did was start small then go big. I started off with one layer (node) and then continued to build off of that while simultaneously adding new nodes to merge together. My first layer was getting a list of all the customers and then I slowly added in additional information like customer plans, billing info, etc. I had 8 nodes that initially started off as their own queries before joining them slowly together and I would occasionally run one-off nodes to verify something or get quick info. While doing this, it helped tremendously that I had the ability to run the pipeline up to a certain node so that I can quickly debug things in sections.
As the pipeline got bigger, the flexibility of re-arranging the nodes and defining the spacing helped me to visualize my data workflow. I could move things around and shift things as needed as the pipeline got more complicated.
And finally of course, multiple merges! This chart wouldn’t be possible without it. I would have to do some serious SQL magic, but instead I was able to drag and drop the pieces together.
All together, the new Advanced Data Pipeline encouraged my data exploration without inhibiting usability or flexibility.
I was finally able to do things I normally would need to do separately, all in one interface. For me, this was a game changer even though I’m comfortable writing SQL queries. With the Advanced Data Pipeline, I had the freedom to explore data without having to write everything in SQL. Plus, I also get the added benefit of a visual component. With this realization, even though the new pipeline is “Advanced,” I found this version to be much more suited to how I approach problems and aligned with how I explore data. For me, the Advanced Data Pipeline is something I will use almost all the time over the basic Data Pipeline, but for someone else it might be different. Either way, now you have the option to see which pipeline works best to answer your data questions.
To learn directly from our Customer Success Engineers on the Advanced Data Pipeline best practices, sign up for our Intro Training webinar on Wednesday, April 19th at 10am PST.


