How Companies Can Use Data to Make Decisions
Posted by on February 9, 2017 Data, Data Analytics
According to a study conducted in 2015, 2.5 Quintillion bytes of data are created every day and 90% of the world’s data today has been created in the last two years alone. Now all of that data isn’t business data, it’s a collection of Netflix views, Amazon purchases, app activity, etc. However, that’s still a lot of data and is a telling sign that businesses should use their data to make better decisions.
We believe that data should be at the core of strategic decision making for every organization, whether you’re in B2C, B2B, academia, non-profit, etc. With the data readily available at your fingertips, it would be a mistake to not use it to inform your business.
The power of data is that it can provide insights that help you answer key business questions, such as how many active users do we have and how can I improve customer satisfaction? The power of data can be broken down into a few simple concepts: data leads to insights, and in turn those insights get transformed into business decisions.
So, how can businesses make better use of their data to make informed decisions? Continue reading as we break down the framework for turning raw data into better business decisions.
Start with a Strategy
With all the data that’s out there in the world, it’s easy to get overwhelmed. Instead, for businesses and organizations, chances are you’re already amassing a large amount of data and the first step in turning data into insights is starting with a strategy.
Work out what your business is looking to achieve by analyzing your data together. This includes thinking strategically by identifying a few key business areas where data can immediately provide value. For many companies, it’s operations, marketing and customer success areas.
Once you’ve identified key business areas, the next step is compiling a list of business questions that you’d like answered via data. These types of questions are going to inform how you go about choosing your solution to transform raw data into insights. In this steps, it’s important to get specific use case from the key business areas.
Wrangle in Your Data
If using your data to inform decision-making is the first way in which companies can better use data, the second way is to bring all your data sources together and ready them for analytics. While, this may sound like a mouthful, there are tools out there that make the process simple (more on this in a few paragraphs).
You’ll want to focus on data sources that will provide answers to your business questions that you’ve outlined in the previous section (see: Start with a Strategy). Let’s take marketers for example, they’ll need to see their marketing automation data blended with Google Analytics and CRM data in order to answer what the buyer’s journey is from discovery to conversion.
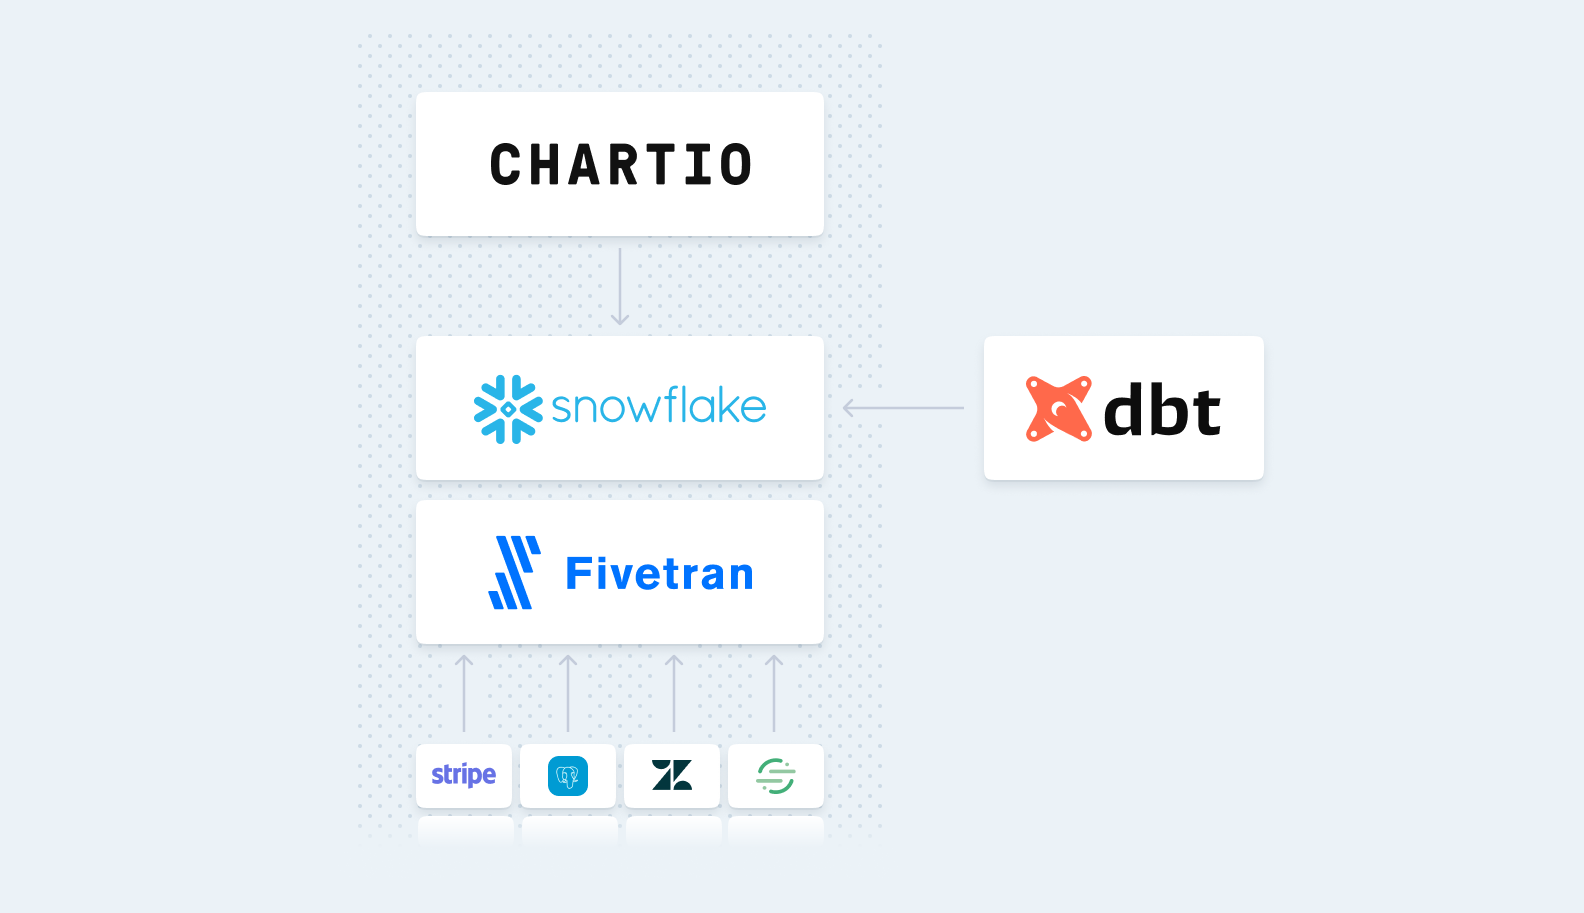
In terms of wrangling in your data, we’ve previously written about modern ETL (extract, transform, load) tools such as Treasure Data and Stitch (both of which are our partners). Both of these companies will work with you to consolidate data into one platform and push the data into a Business Intelligence (BI) solution (like Chartio). Similarly, many BI solutions connect directly to databases—like Google Analytics—without needing an ETL tool.
Analyze Your Data
Next up: transform raw data into insights. For this process to be useful, you need to learn something new from your data—such as calculating customer churn or understanding product adoption, etc.
There are plenty of ways to extract meaningful insights from raw data: Excel, build your own analysis tool, or invest in a BI solution (our recommendation). However, you decide to go about analyzing your data, it’s imperative that you present and distribute your findings.
If analyzing data from disparate data sources allows for Marketing to clinically map out the buyer’s journey and therefore optimizing their spend and programs, that’s a powerful insight. If one business department is able to glean such meaningful insights, imagine what can be discovered and accomplished at a company-wide level.
Visualize Your Data
According to the Harvard Business Review, “the most compelling infographics… mine relationships among overlooked variables to tell you something unexpected and get you thinking.” While, “the least effective confuse you (the food pyramid), overwhelm you with data (nutrition labels) or are just plain boring.”
Data demands to be noticed and should take front and center when it comes to decision-making. With that, companies often struggle with visualizing their data in a simple and powerful way. Often there are too many charts or data points than can cloud the overall data story. When creating visualizations for your analyses, remember to prioritize clutter-free dashboards for better understanding.
Conclusion
To answer the original question simply, our answer is this: institutionalize data and analytics into all aspects of the business. Cultivate a business culture that feeds on data and analytics in order to make decisions and drive positive actions.


