Leverage Data to Create an Organized Marketing Dashboard
Posted by on June 8, 2017 Data, Data Analytics, Dashboards, Marketing Analytics, Marketing
[Editor’s Note: This is our second installment in our “CMO’s Guide to Dashboards Blog Series.” In our previous installment, we provided a glimpse into the top marketing challenges and made our case for a wider emphasis on marketing dashboards. Click here to read our previous post introducing our latest white paper, The CMO’s Guide to Dashboards.]
Data is a Valuable Asset to Marketing
With the average marketing team using 17 different technologies, it amounts to a lot of disparate data sources. As data is often housed in these disparate SaaS tools and business applications, unfortunately sometimes it means that Marketing doesn’t have direct access to their own data, and ultimately unable to make informed decisions.
Rather than struggling with siloed data and getting one-sided insights, with modern data warehousing tools and self-service Business Intelligence solutions, Marketing can connect all their disparate data sources and visualize their data.
In creating your marketing dashboards, you’ll be able to easily combine data from your Marketing Automation, website analytics and CRM to create a bird’s-eye-view into your performance. Whereas if you’re relying just on your Marketing Automation dashboard or charts created in spreadsheets, only data from a singular database will be used. The power of dashboards remains in their power to surface deeper insights because it’s pulling data from all your data sources.
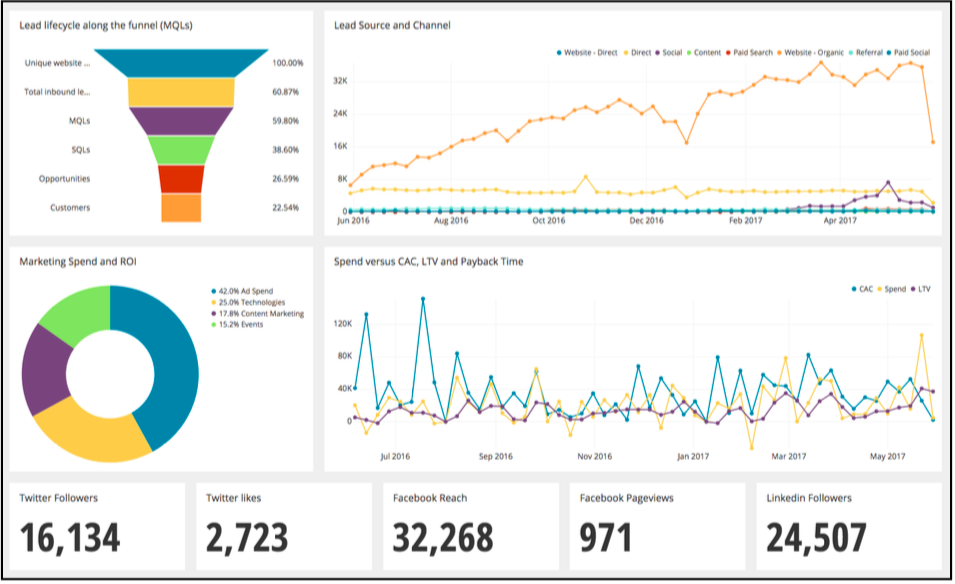
Dashboards are only as powerful as the metrics it tracks. For a performance dashboard, it needs to tell the high-level story on what the Marketing team is contributing to revenue. To get the most out of your data, and show the full power of the marketing machine, you need to pull in data and create one performance dashboard.
Pulling from your Marketing Automation, website analytics, CRM, spreadsheets, email marketing, product usage data and advertising data, you can create a robust dashboard that tracks:
-
Lead lifecycle along the funnel (MQLs)
-
Lead source and channel Marketing spend and ROI
-
Spend versus CAC, LTV and Payback Time
-
Social Media reach and engagement
While given the possibility to combine every marketing data source under the sun together, it’s important to aggregate data wisely. It’s tempting to throw all your data together and make it work. In the Rethinking Your Ad Spend: 5 tips for intelligence digital advertising webinar, panelist Craig Vigor of Verdensa Consulting recommended that we pay attention to their data, and think critically about what should and should not be combined together.
Meaning, every business application and SaaS tool works differently and their definition of data, even if it’s just an impression, can vary. So, we should think critically about if it makes sense to combine multiple data sources together.
A marketing dashboard needs to present accurate data, so understand how your data sources define certain attributes is critical in achieving that goal.
Marketing Dashboard Best Practices: Organization
Creating marketing dashboards doesn’t have to be a difficult process. We recommend taking an editorial approach to dashboard creation and organization. Meaning, think of a single dashboard as a story and organize it as you would a linear story.
If thinking about dashboards as if they were stories is too abstract for you, think about a dashboard the same as you would a presentation. Great presentations tell compelling stories, and so should a dashboard because they’re ultimately a presentation of data and hard work.
With that, we also recommend that you keep your dashboards simple and always tie them to marketing goals. Because even if the data is available, it doesn’t mean that every chart needs to be displayed on a single dashboard.
In our example of the performance dashboard, it doesn’t show every single marketing metric possible. Rather, it shows the high-level metrics that relate directly to revenue.
Other dashboard organization best practices include:
-
In having an edited approach to dashboards (fewer, but crucial charts on a dashboard), your dashboard will load faster because it doesn’t have to refresh superfluous charts
-
You’ll be able to find the information you need, faster without searching and scrolling through a laundry list of charts
-
More focused dashboards encourage editing, as opposed to an ongoing sprawl of information, reducing data fatigue
As our collective attention span shrinks (some say it’s now only eight seconds), creating smaller and concise dashboards increase the overall effectiveness of dashboards. Plus, it furthers discovery and exploration, which we as marketers should be inherently interested in.
Stay tuned for our next blog post as we share best practices around designing your marketing dashboards. For immediate action creating and leveraging robust dashboards, so you can track ROI, download our white paper, The CMO’s Guide to Dashboards.


