Introducing The Six Dashboards Every Startup Needs
Posted by on July 18, 2017 Data, Marketing, Marketing Analytics
From planning business strategy, product development, marketing, sales forecasting, finance, customer satisfaction—there’s a lot of moving parts when it comes to operating a SaaS business. Throw in being a startup, and that’s where things get really interesting.
Even at a startup, each part of the business (Marketing, Sales, Engineering, etc.) all has their own tools and technologies that create and collect data. In the critical stages of being a startup, when everyone is still trying to make sense of it all, the way to make everything come together is through dashboards.
The Power of Dashboards
Dashboards have the ability to reach every aspect of the business because they’re powered with your company’s data and help surface insights that help you answer questions and set goals. Without dashboards, it would be nearly impossible to know what’s working and what’s not, and for startups, not knowing can be catastrophic.
Dashboards transform business data into something actually useful for everyone within the the company, ultimately streamlining the process of communicating information.
The understanding of dashboards by everyone in your organization is crucial. By default, humans can understand visual information in an instant. With operating a startup, you want to get your ideas across quickly and dashboards are the answer.
Second, not only do we as human beings understand visual information instantly, we’re more likely to remember it. Meaning, every growth chart trending up into the right and every marketing spend budget chart that has exceeded our budget—we remember all that and will learn from it.
Let’s look at a side-by-side comparison of something extremely visual versus something less visual:
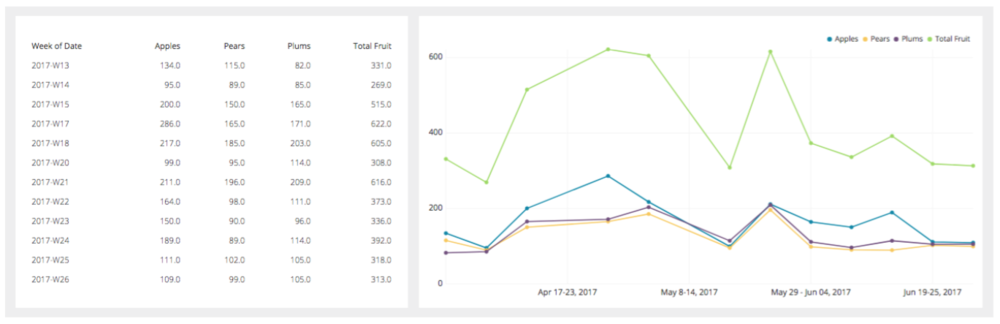
A table chart versus an data visualization chart.
According to the aforementioned 3M study, we as humans better understand the information presented on the right rather than the left. And while both data presentations are insightful, the visually appealing and colorful visualization stands out and remains in our memory.
Dashboards Provide Insights Right When You Need Them
For any data-driven company, a CEO wouldn’t think twice about consulting their dashboards before making a crucial decision. As a startup, sometimes you don’t have the luxury of being proactive when it comes to analyzing data. You’re releasing new features, implementing new messaging and handling multiple sales prospects at any given time.
With that, it’s important to rely on always-on dashboards that show the KPIs and insights you need to operate your startup in real-time. Gone are the days of analyzing siloed data in Excel, manually updating a spreadsheet and then emailing out a report at the end of the week. Startups function in real-time and so should your dashboards. Let’s focus on growth and getting to the next stage with your business, rather than spending hours pulling data to get insights.
Our White Paper
If you have yet to create startup dashboards, our white paper will be core to your creation process. Download The Six Dashboards Every Startup Needs for more insight on how to implement these dashboards and to learn:
-
Why dashboards are essential
-
Dashboard best practices in organization and design
-
The six must-have startup dashboards
-
How to leverage your dashboards to grow your startup