Rethinking Ad Spend: 5 Tips for Smart Digital Advertising
Posted by on April 6, 2017 Marketing, Marketing Analytics, Data Analytics
In our latest webinar, Rethinking Your Ad Spend: 5 Tips for Intelligent Digital Advertising, we partnered with Digital Mouth Advertising and Verdensa Consulting to show you how to best allocate spend and create optimal dashboards for digital advertising.
There’s no fighting it - a marketer’s job today is all about proving return on investment and using data to drive decision-making. Luckily, in this webinar we had two digital marketing seasoned pros on hand to explain digital advertising metrics and how to create a dashboard that effectively tracks your efforts.
Follow the Data, It Doesn’t Lie
“Today, successful marketing requires data and tracking to understand the why and when,” said Robert Pettee, co-Founder of Digital Mouth Advertising. “Marketers are leveraging their ad spend to learn how and where to spend their next dollar - learning what they can do better tomorrow from yesterday.”
Since Robert has extensive experience working in SEO, SEM, CPC, CPM and has a long list of clients where his agency works to increase their digital presence, during the webinar, Robert shared how successful companies track their targeted ad campaigns.
Each campaign tracks:
-
Demographics: age, gender, marital status
-
Psychographics: interests, social preferences
-
User Behaviors: shopping habits, subscriptions, recreational habits
-
Geography: IP address, zip code, city/state
-
Messaging: promotions, discounts, sales and verbiage/images that drive results
Robert suggests that companies label their ads according to who they target and label tracking information into the ‘destination URL’ parameter for every ad. Then, all this data will feed into their web analytics platform and be ready for visualizations in Chartio.
With an extremely targeted ad campaign that has proper tracking parameters, this allows you to do more of what works best and do less of what doesn’t work. For Robert, this means that you have a laser focus on the details and develop a keen eye on statistical significance.
Dashboards for Actionable Business Value
During the second half of the webinar, Robert handed over the reigns to Craig Vigor of Verdensa Consulting, who has nearly twenty years of data analytics experience.
As digital marketing campaigns collect more data and grow in sophistication, it’s easy to get buried and lose sight of the business values which data is meant to uncover. With that, Craig shared a few dashboard best practices to eliminate any risk of data fatigue.
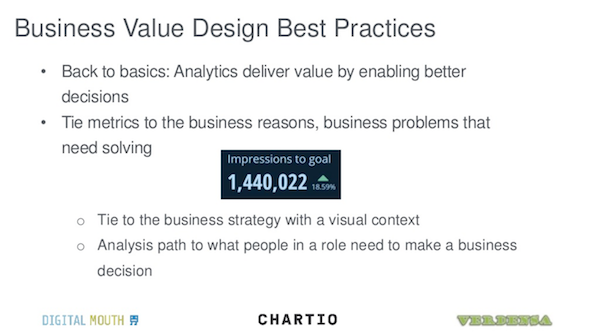
In the above slide, Craig shares a few best practices around tying dashboards to digital advertising metrics and KPIs.
“The challenge isn’t getting the data,” said Craig. “It’s about filtering the data and focusing in on answering relevant business questions and visualizing KPIs. The purpose of analytics is to empower data-driven decisions.”
Much like our previous blog post, Best Practices: Keep shorter dashboards, Craig suggests that just because marketers have a lot of data - that doesn’t mean that everything needs to be on one dashboard.
Having everything on one dashboard gets confusing and forces the viewer to dig through every chart to find the right one, often leaving them with empty answers.
Rather than having people swim through multiple charts, Craig suggests to minimize the data noise and focus on presenting metrics that are directly related to predefined business questions. The point of a dashboard is to give your audience what they need to make decisions, and by looking at a dashboard, they should be able to get a snapshot of what’s happening across the entire campaign.
Digital Advertising metrics to track across all campaigns:
Impressions for their budget
- CTR, CPC, CPM. etc.
Three Dashboard Questions to Ask
“The key to effective digital marketing dashboards is a laser focus on where business users can make actionable decisions,” said Craig. For every dashboard that Craig creates, he asks three questions:
-
What did I say?
-
Where did I say it?
-
Who did I say it to?
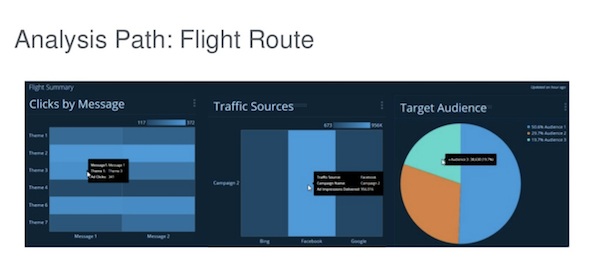
With these three questions in mind, Craig has created the following chart to answer those pressing questions.
-
Clicks by message (What did I say?): this chart takes a look at what’s working, so you know where to focus the rest of the campaign
-
Traffic sources (Where did I say it?): this chart shows which channels the campaign used, ultimately telling you which channel is most effective
-
Target audience (Who did I say it to?): this chart looks at the demographics of your audience and presents learnings on where to tweak and allocate budget for your next campaign
Conclusion
For a complete tutorial on how rethink your digital advertising spend and create optimal dashboards, watch our on-demand webinar.


