The Four Stages of Data Analytics
Posted by on August 8, 2017 Data, Data Analytics
Through Chartio I’ve had the pleasure of meeting with hundreds of organizations, big and small, to learn (and help with) the ins and outs of how they work with data. While each company is its own unique snowflake, I’ve found that generally companies go through four stages toward an ideal analytics destination that I call Decentralized (aka. Democratized) analytics.
In this post I describe each of these stages, their pros and cons, useful tool suggestions and some tips on getting on to the next stage. I hope this will be helpful to you as you identify where you are and where you’d like to go. Additionally, for each of the struggles listed, we’ll be working on more tips/tricks/content for overcoming those obstacles, and be sure to link back from this article to help with further advice.
The Four Stages of Data Analytics
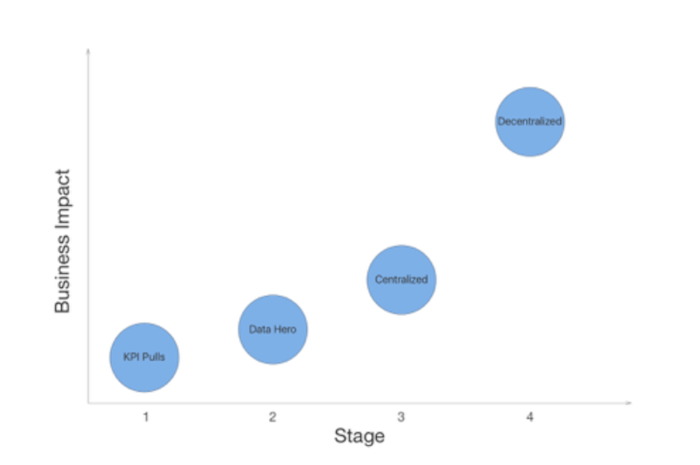
Figure 1. Four stages of data analytics in relation to its overall business impact. As we’re living through the golden age of data creation, as a business grows, so does its data. With each incremental stage, that business and data grows almost simultaneously and in result impacts on another.
Stage #1: KPI Pulls

When an organization is just starting out you just don’t have much data, and frankly it’s less important. You’re a small, early-stage business with a laser focus on building a valuable product and getting people through the door.
Beginning Y Combinator startups are a great example of this. Y Combinator has each startup choose one metric (courses, users, sales, shares, etc) that they will focus on during their three months in the program. It’s best for these founders to focus on driving that one growth KPI and forget about the rest.
To operate at this stage, you simply need to have someone on your team (often a Founder or Engineer) run a query every once in awhile.
-
Pros: Cost efficient (no extra tooling required), focused KPIs since you know exactly what you want
-
Cons: This is a manual process each time, limited-to-no visibility into the health of the business at any given time
-
Tools: SQL, Excel
Stage #2: Data Hero

At some point, if all goes well, a company starts making money or raises it and hires a few more people to the team. The company will start to have multiple teams like Marketing, Product and Sales, each with their own set of metrics that indicate and drive their success.
What we see at this stage is someone inside the company takes it upon themselves to help the company get more serious about their analytics. At Chartio we call this person (most often a Founder, Marketer or Product Manager) the company’s Data Hero.
These Data Heroes choose a tool and create a number of dashboards to help the company track those KPIs and gain those much-needed insights. Enabling Data Heroes is a great start to democratizing data across an organization, with that here are a few things to keep in mind:
-
Pros: Relatively cost efficient, still fairly focused
-
Cons: more but still limited visibility, can get messy, it’s usually not the Data Hero’s main job
-
Tools: Chartio, ETL tool
Stage #3: Centralized
Hopefully those insights, and or a bit of luck, have proved useful and the company continues to grow. As this happens a company’s hunger for data gets too large for the Data Hero to feed. Companies then start to hire Data Analysts and or Data Engineers to handle this volume and go one of two routes. They can either choose to have a centralized or decentralized data organization.
The centralized approach to analytics consists of a team of Analysts and Data Engineers that control a majority of an organization’s analytics projects and reporting. Sitting in one group, this type of analytics approach allows the Analysts and Data Engineers to pool together and support the needs of the business in a prioritized method.
Most or all data requests go through this data team which creates consistent reporting but a lot of bottlenecks, often leading teams to ask less and less questions. When evaluating a centralized approach, here’s a few things to consider:
-
Pros: Consistent reporting, greater visibility into the health of the business, organized
-
Cons: Major data bottlenecks, minimal context for data, many expensive technical hires, people stop asking
-
Tools: Data Warehouses (Amazon Redshift, Google BigQuery), ETL (Panoply, Stitch), Chartio
Stage #4: Decentralized
Lastly, we feel the ideal structure for a mature organization’s analytics is a decentralized one. This is a relatively new concept as the tools for analytics are only now becoming usable for non-experts. With that, we believe that decentralized analytics is the future.

While there are advantages to a centralized approach, as the name suggests, a decentralized approach unburdens the data team and breaks apart the data silos.
A decentralized analytics approach brings data and analytics to everyone in your company, where many in the company can do their own analytics, supported by instead of gated by, the internal Data team.
-
Pros: Highest visibility, those with business context have access to data
-
Cons: Potentiality of getting disorganized, data inconsistencies, large load on databases (with so many people querying data)
-
Tools: Department specific data sources, Data Warehouses (Amazon Redshift, Google BigQuery), ETL (Panoply, Stitch), Chartio
The Benefits to Decentralized Analytics
While some may have false fears of democratized data, over the years, I’ve learned that decentralized analytics is the future of success.
With that comes: faster and better insights, more question asking and answers, less bureaucracy and a decrease in wasted time and effort. Thus freeing up the data team to focus on more productive data projects, and enabling business users to become data-driven.
To learn more about how other high-growth organizations organize their analytics and data teams, get insights from Prezi and Udemy.


