The Six Business Dashboards that are Core to Startups
Posted by on February 2, 2017 Data Analytics, Dashboards
Operating a startup can sometimes feel like walking through a minefield. At a moment’s notice, you might need to reverse your company’s course and make crucial changes to product, strategy and campaigns.
For startups to succeed, you need to create value with your customer base. And, to be clear, there’s no magic bullet to creating value. You have to earn it, and work hard for it. With that, there are ways in which you can track your progress towards ensuring customer value, and that’s through dashboards.
Take a walk through any startup office and you’ll see the same thing—dashboards on TV screens, displaying up to the minute reports and analyses on what’s going on with the product, business and operations. This public view into data is the core to growing startups. Additionally, you want to make sure that your dashboards are also optimized for understanding.
Prioritize a clutter-free dashboard to increase understanding and enable everyone to focus on the information at hand, rather than getting lost in the data. Make sure that your dashboards are digestible. Further, dashboards are designed to tell a story, so make sure you’re conveying the right story.
With that, let’s dive into the core dashboards for each growing startup.
The Operations Dashboard
Having a lean operation is key for growing startups. Often times, there isn’t a lot of extra cash flowing around, so keeping a close eye on core operations is optimal. Here are a few high-level metrics to add to your Operations dashboard:
-
Operating Cash Flow: Cash flow coming in and out of your business
-
Headcount by department: broken down by month & year (x-axis) # of employees (y-axis) and color code the different departments
-
Revenue and budget: tracking departmental spend, etc.
A high-level operational dashboard will tell you the health of your business. For many Operations professionals, striving towards operational excellence is a goal (and KPI).
The CEO Dashboard
This dashboard tracks high-level departmental metrics from Customer Success, Engineering/Product, Marketing, Sales and Operations. In tracking all operational KPIs from every department in one place, it gives CEOs instant access into company growth, progress and highlights any potential problems.
While every SaaS business is different, the CEO dashboard typically consists of:
-
ARR (Annual Recurring Revenue)
-
ARR per account
-
Customer retention
-
Total number of customers
-
Conversion: lead to win rate
This dashboard gives you clarity into all parts of the business because it pulls from every SaaS application and business database that your company utilizes in its data stack—including CRM, marketing automation, payment database, product databases (PostgreSQL, MySQL), data warehouses (Amazon Redshift, Google BigQuery, Treasure Data) and event web databases.
The Marketing Dashboard
As marketers are continuously iterating on their messaging, campaigns and programs—metrics can often fluctuate as they A/B test their efforts. We recently hosted a webinar with Treasure Data on how to create the ultimate marketing dashboard and wrote a recap blog post on the webinar. See the example dashboard below:
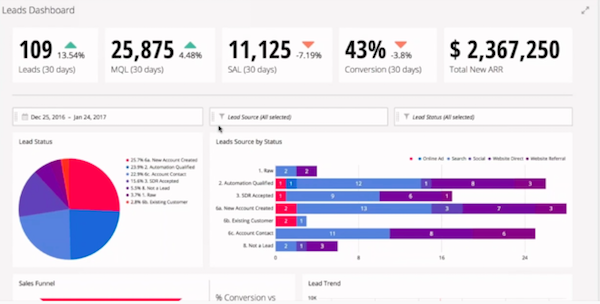
In addition to MQLs and lead source, other crucial charts on this dashboard should include:
-
Marketing spend
-
Spend vs. Customer Acquisition
-
Campaign performance (PPC and organic)
-
Lead generation (measuring the effectiveness of inbound activities)
The Sales Dashboard
With one glance at a sales dashboard, it’s easy to understand how your revenue business is performing. Sales is all about making your number, and a sales dashboard has plenty of numbers to share.
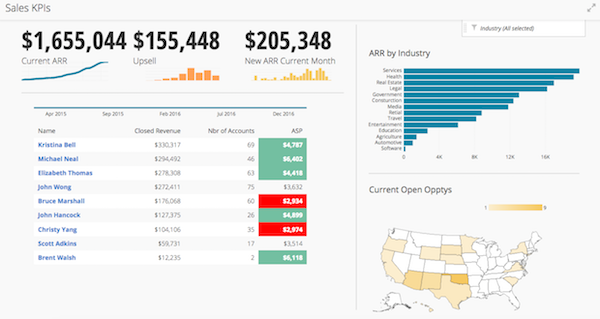
Creating the sales dashboard requires a cohesive story: how new business is doing. With that, here are a few key metrics to track:
-
ARR (Annual Recurring Revenue)
-
New accounts
-
ACV (Annual Contract Value)
-
Sales funnel
-
Closed-Won Deals (Opportunities won)
-
Average Days to Close
The Customer Success Dashboard
As Sales is one portion to the a company’s revenue lifeblood, recurring revenue is just as important. Having paying customers is paramount to startups, but having returning customers is just as critical.
A customer success dashboard will give you a full picture of your customers and will provide questions and definitive answers, such as, how do did we do last month? Which customers churned? What’s the dollar amount of churned revenue? How are we doing this month in recurring revenue?
Charts to include on the customer success dashboard should include:
-
Total Customers
-
ARR (Annual Recurring Revenue)
-
Customer Churn
-
Customer Upsells (added seats in a subscription model)
The Customer Satisfaction Dashboard
In addition to providing a valuable product or service to customers, as a growing startup (and any business), you’ll want to provide your customers quality support. A leading indicator in customer churn is customer satisfaction—how content are your customers with your product and how available is a support channel?
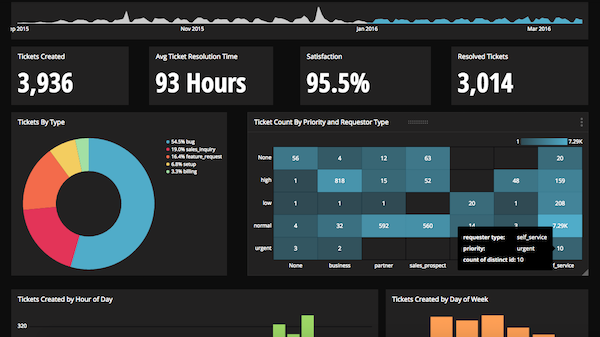
Elements a customer satisfaction dashboard should include:
-
Tickets created / Resolved tickets
-
Average ticket resolution time
-
Satisfaction percentage
Conclusion
Remember, at the end of the day a startup is continuously evolving and iterating. With that, you should still continue to track high-level metrics that will allow you to keep a finger on the pulse of your startup. To be a successful startup, the key is to provide value to your customers that they cannot get anywhere else. One step to providing consistent value is tracking metrics in a quantitative way, and being agile enough to iterate as necessary.
For more insights on how to create these dashboards, download our white paper The Six Dashboards Every Startup Needs to get in-depth details on implementing these dashboards at your startup.


