What’s Different with the New Visual SQL Interface?
Posted by on March 10, 2020 Chartio
TLDR; Visual SQL is the new name to the greatly upgraded version of our Data Explorer. We’ve been working hard on it for a long time and created something with more power than Advanced mode with greater ease of use than Basic. In blind user tests Visual SQL shows that 8 in 10 people are intuitively able to make advanced queries and charts. It’s a major improvement in almost all aspects and it’s available for you to try today and migrate to shortly.
A little over a year ago now we started an internal task force to greatly improve the usability and power of our Data Explorer. We started with a large set of blind user tests using usertesting.com on both our interface and some competing products. The good news was that we were (as we are usually awarded), the easiest to use interface. The bad news was that only 1 out of every 10 users we tested could intuitively make queries and charts.
We have excellent free training and documentation, and as a result we know that a way higher ratio of users end-up using Chartio but we knew if we truly want to solve our Mission to JOIN people ON data, we would need to significantly move that 1 in 10 number without relying on trainings.
We made thousands of artboards in Figma and built dozens of working prototypes of various approaches. After months of hard work we still weren’t moving that number of 1 in 10. Eventually multiple of our ideas came together and after several hundred user tests we got to 8 in 10 people making advanced queries and charts!
This new interface is still as flexible and powerful as the old one - but is now just that much more intuitive to use. You should expect to get more of what you want automatically, and be able to get what you need in significantly fewer clicks and a better use of space.
What’s new?
There’s so much new in Visual SQL. It was a complete redesign and re-write on the front end. Here we’ll go over some of the main differences between the old Data Explorer and the new Visual SQL.
No need for Measures & Dimensions boxes
It’s crazy how many times we’ve had to explain to people what the difference between a Measure and a Dimension was, and what’s going on behind the scenes when you choose one over the other
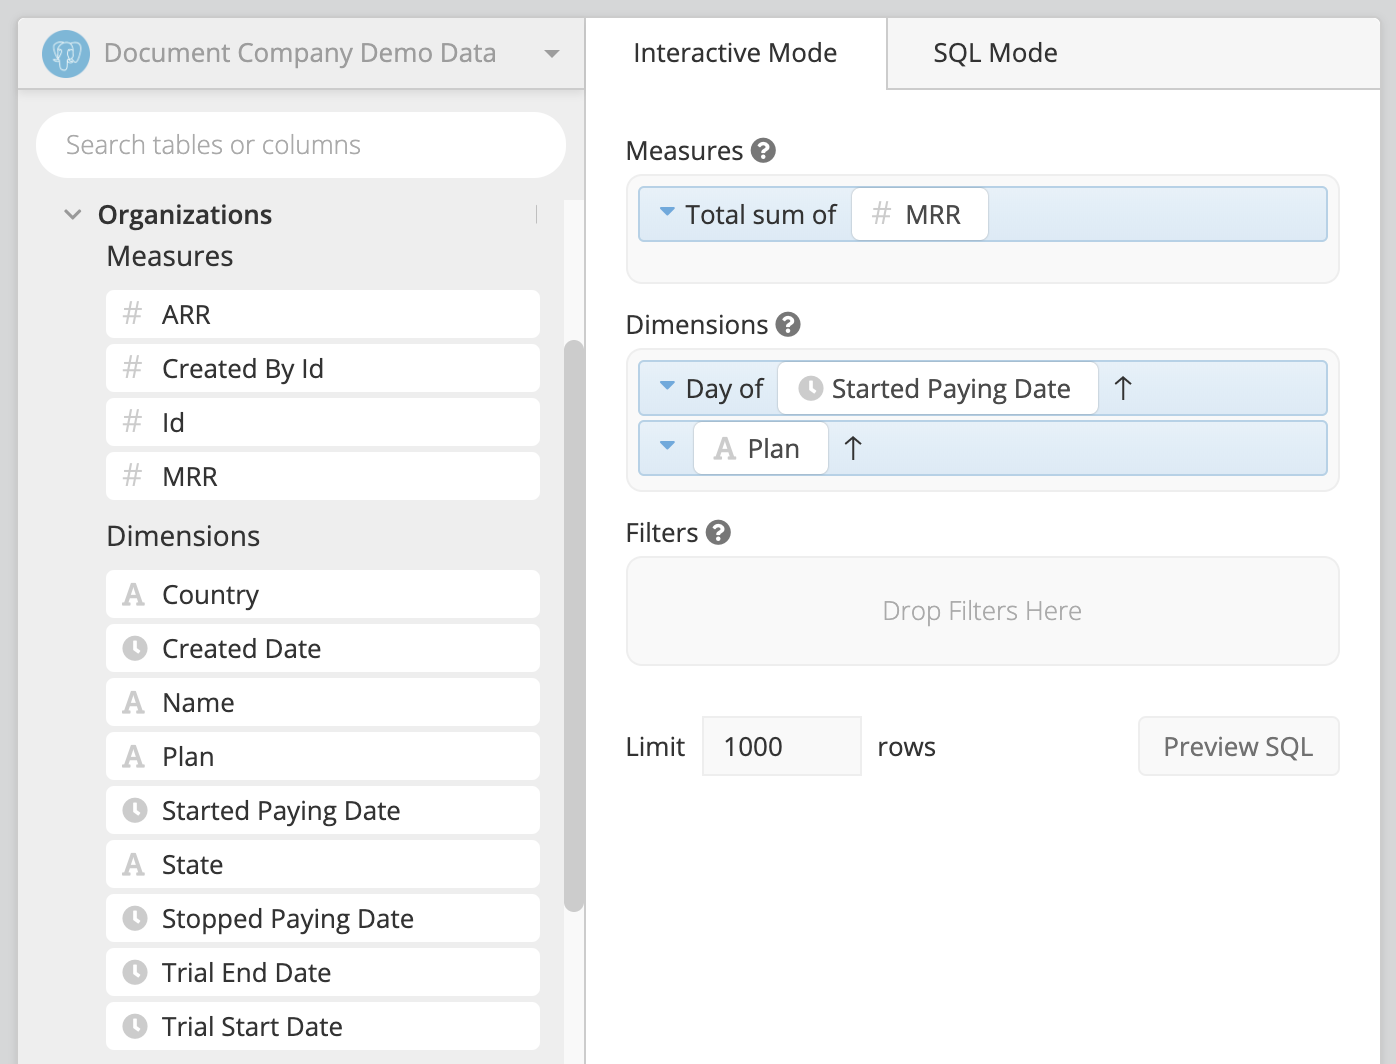
And yet, it’s the first thing users are confronted with when they start. We knew when designing that we’d have to get people over this big learning curve and either design it out or make it obvious. We ended up figuring out how to design it out.
We realized, that with all our historic data, we could guess 88% of the time what grouping and aggregation was needed - and that we could create an easy interface to modify it easily in the 12% of cases it’s not correct. Now, you don’t drag columns into a measure or dimension, you just simply choose what columns you want. Columns are then auto assigned a group or aggregation and a preview of the results shows up right away. Showing the structure of these results means users no longer have to do heavy mental work on what outcomes will come from different decisions. And it allows easy, intuitive changes.
Data Browsing with Table preview
Browsing columns in a vertical list isn’t a very natural or informative experience for users. People question “what’s really in this column? Is it blank? Is it what I think it is?” and the experience doesn’t feel like anything familiar.
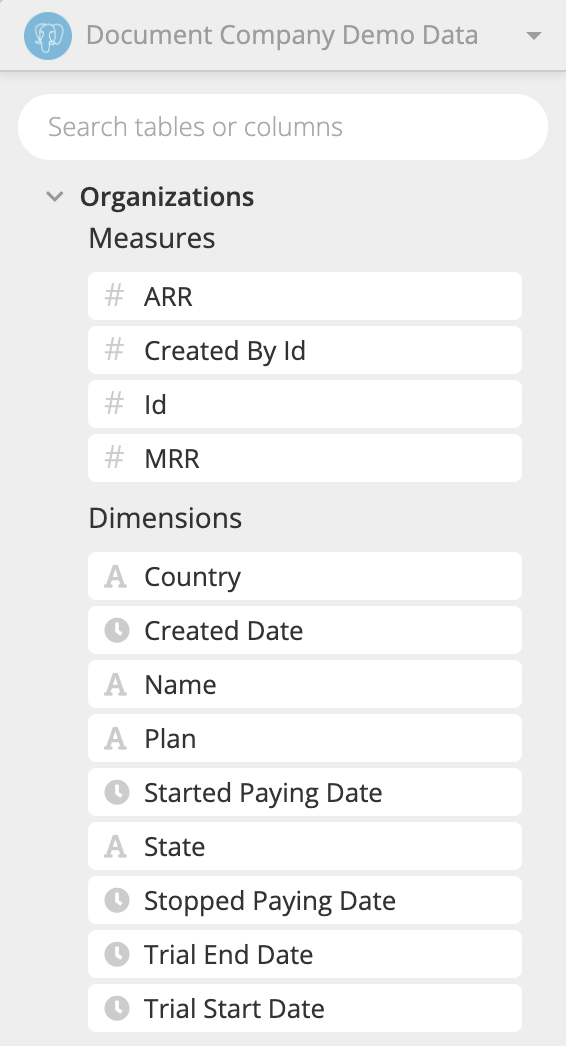
So we broke this out and combined it with our sample data preview - so that users now browse actual tables. Horizontally laid columns, showing exactly what’s in them, we found to be a lot more familiar for users, and gives a much better informed selection.
Works great with search too
For any size dataset search is important. We made that now less clicks away with combining our browse and search for column functionality together. When you click to add a new column, you can either browse through the tables, or just start typing.
Fixed Results Table
Something people really like about Advanced mode is the fixed results table at the bottom of the page. In basic mode the results are only seen when you expand into each of the pipeline steps and have a much smaller footprint.
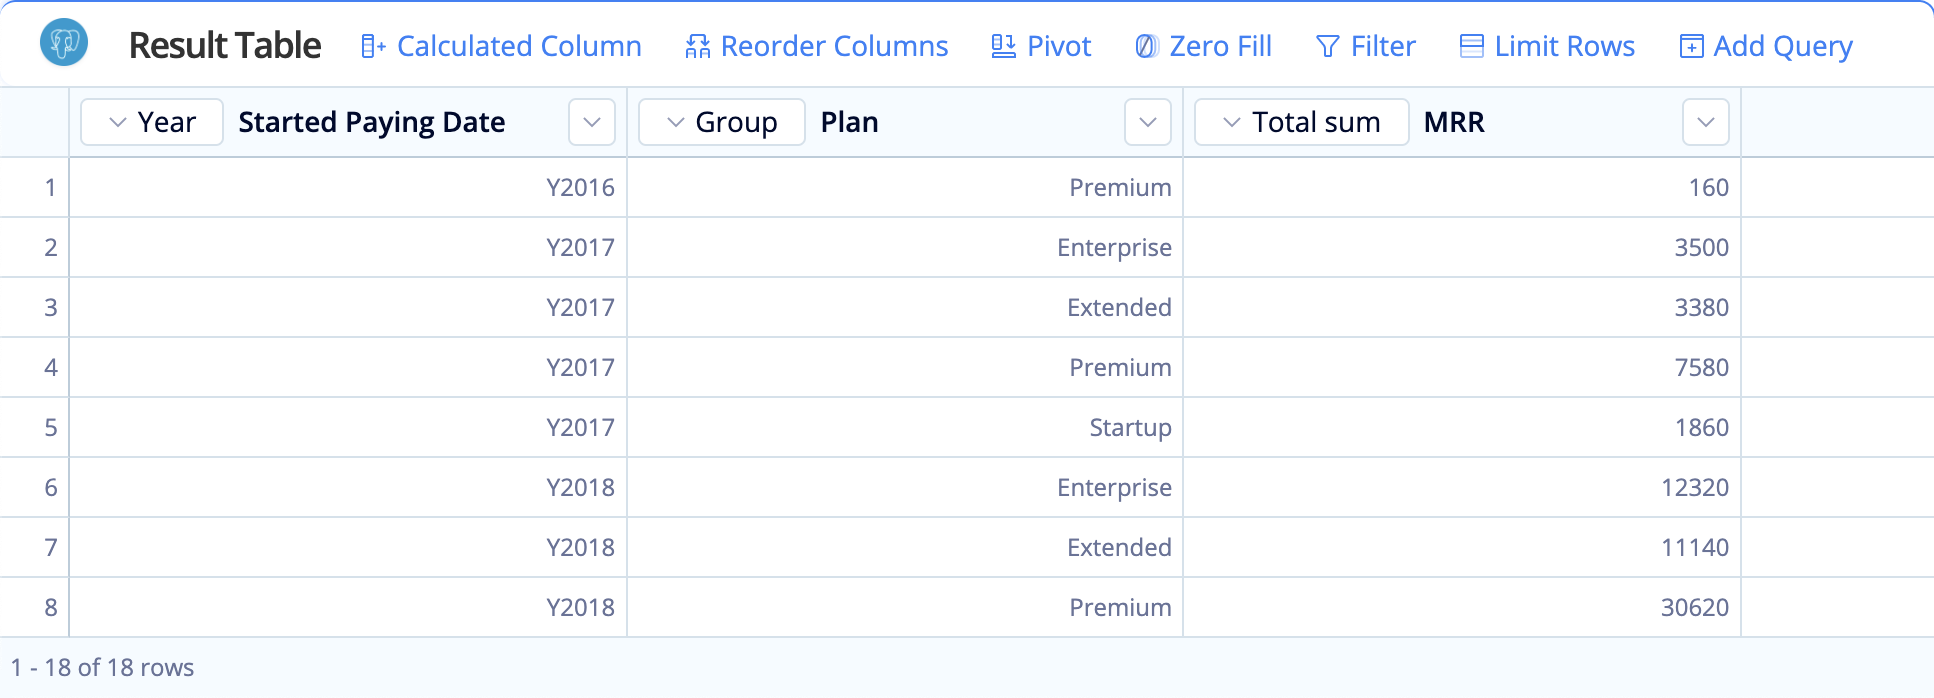
We found a fixed table was much preferred in user tests and created a less jossiling experience. It was also ideal for the Actions interface to work directly on tables and actions (described below) and was designed heavily after Excel, to give users a feeling of the familiar spreadsheet of data fixed to the lower half of the page.
Result structure previews
It’s really hard to guess what the data is going to look like as you take actions, and annoying (and sometimes impractical) to have to wait for a query to return in order to see that structure. Wanting Visual SQL to be as responsive as possible, we use example/sample data to show a preview of the structure of the output in it.
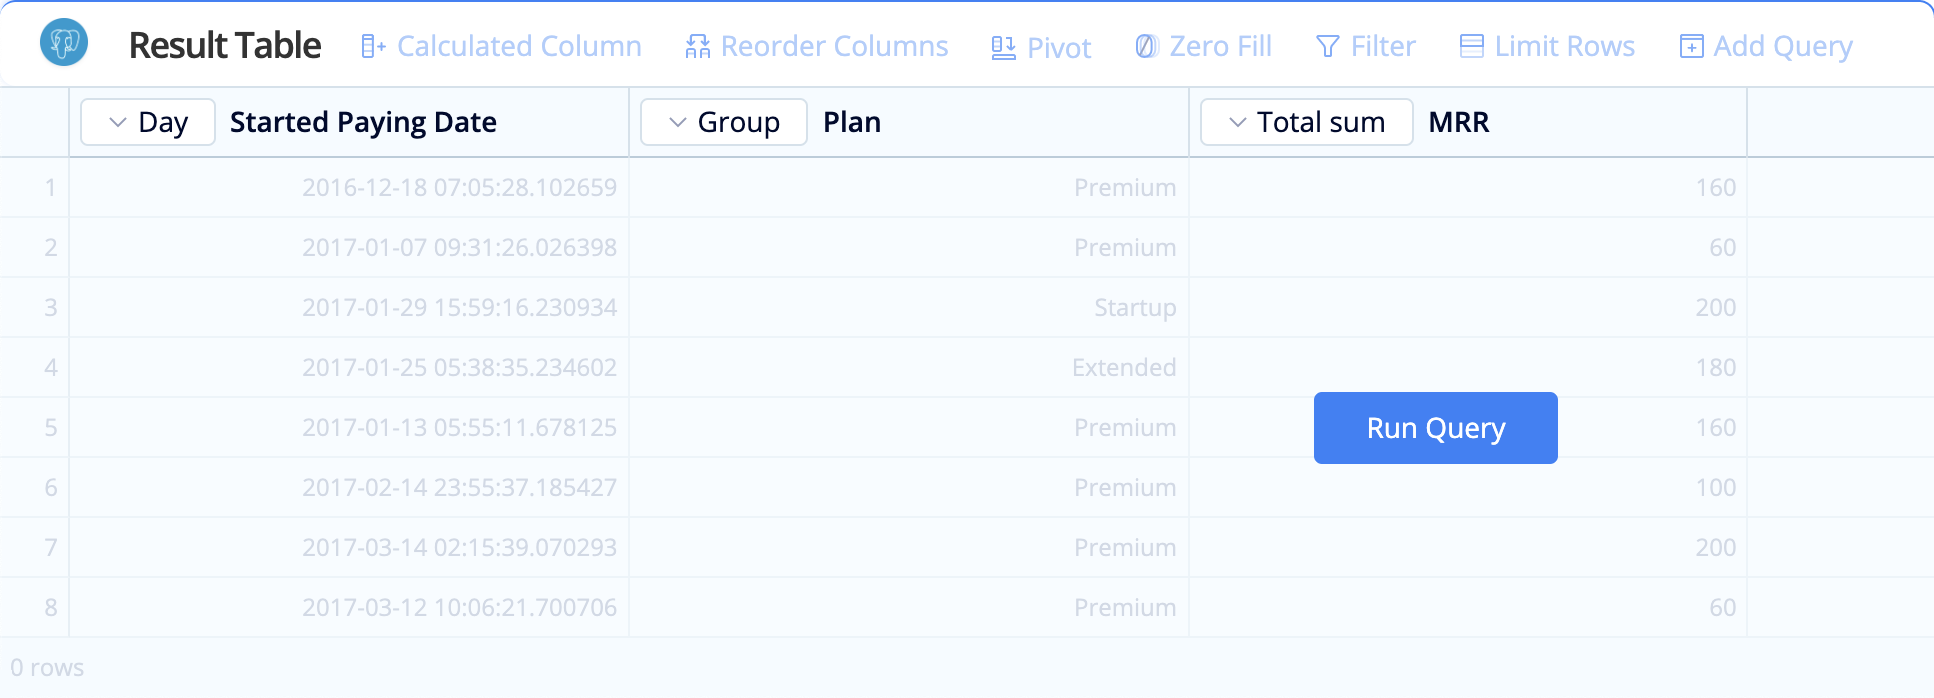
While the data isn’t the exact data that will be returned, the type of data, column names and structure of the table is all correct.
Actions/Steps taken directly on tables and columns
In the previous Data Explorer adding step required you to click “Add Step” and then choose the action you wanted to perform.
This somewhat hid the power of our flexible pipeline. People didn’t know it was there, and also it gave little context to the data you’d be applying a step to. So we pulled these different actions out into two types - Column Actions - those applied to single columns, and Table actions - those applied to the full table. And then we built them into the results table, always intuitively available and as excel like as possible.
Excel like formula bar
Continuing further on that familiarity with excel, when creating a new column,editing an existing one, or any other action that requires more information - we now have a much larger input placed intuitively above the results table, as you would experience with Excel formulas.
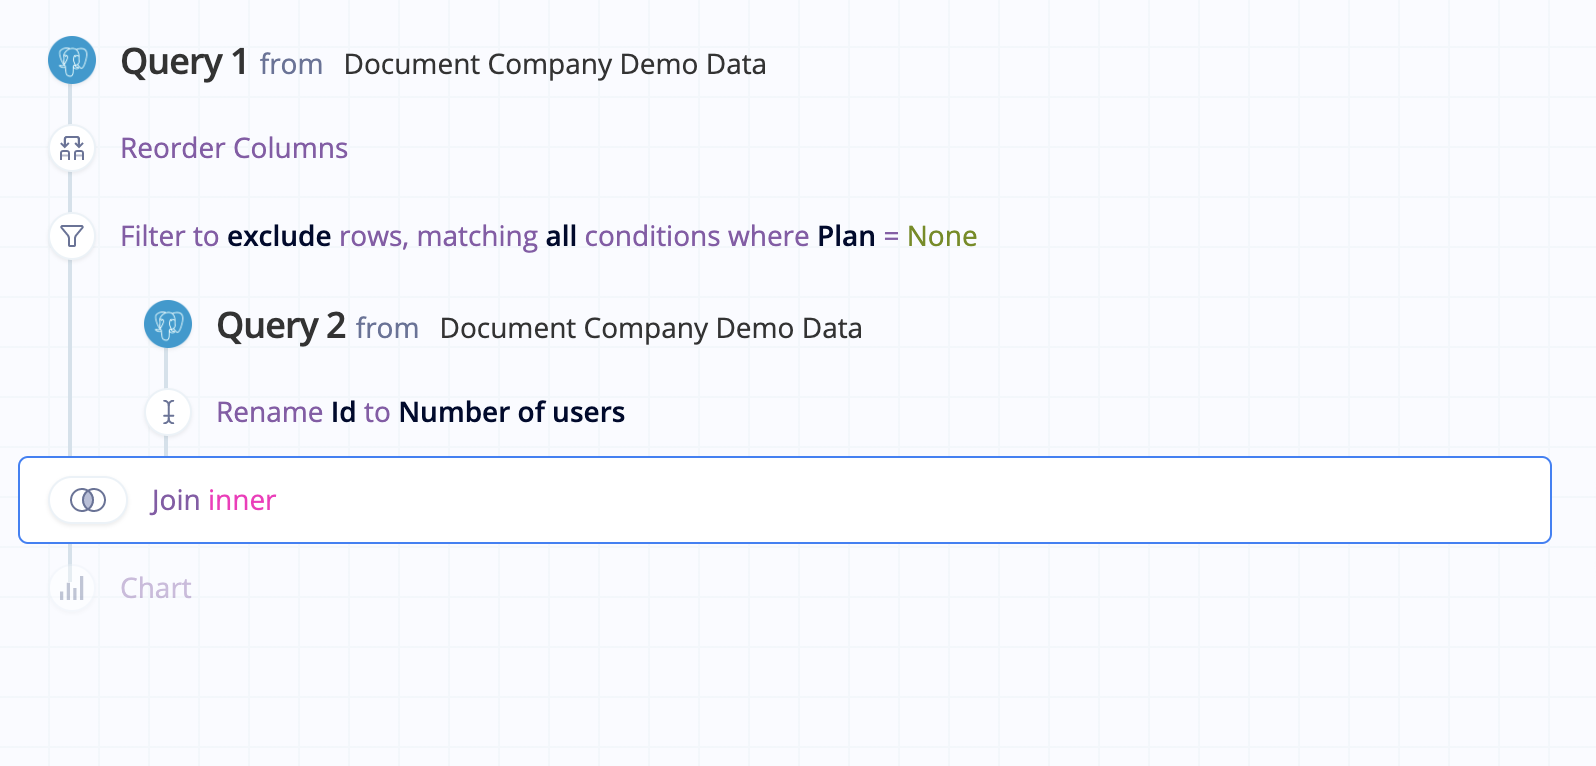
Multiple merges allowed (like advanced mode)
Of course one of the most popular features of our Data explorer is the flexibility in querying and merging in multiple different data sources. One of the previous limitations of Basic mode (and reasons for advanced) was the lack of flexibility in merges. This limitation has been removed from Visual SQL which now allows as many merges in any order..
Trying Visual SQL
This was a total redesign and rebuild of our exploration interface and there’s a lot more new than just listed above. If you’ve read this far you should go take Visual SQL for a spin yourself! In Chartio from the Explorer you’ll see a new button Try Visual SQL which will take you to the new interface.

We hope you find it familiar but increasingly intuitive. For more information and tutorials on it we’ve created some extensive documentation.
You can save charts to your dashboard and continue working on them in the new Visual SQL just as you would the old explorer. If you prefer this interface and are ready for it to be your new default email us at support@chartio.com.
Migrating forward
Visual SQL is built on the same powerful backend as Advanced and Basic mode. We’re working with customers to slowly migrate their existing charts and dashboards over, but there is no rush here - Chartio will continue to work as usual until we work with you on the migration. Talk to your DA or email support@chartio.com if you’d like to learn more.
What’s next?
There are still a few kinks to work out in Visual SQL and many more continued improvements planned. It’s not yet as solid and bug free as the well battle tested Data Explorer. We’re getting it there as fast as possible with continued customer usage. We’re keeping a large team focused on continuing to the next levels of Visual SQL, with many planned improvements including more actions, better chart settings, shortcuts, increased ease of use, and much more.
Get involved!
We’d absolutely love to hear your experience with Visual SQL. We love any shared notes, or recorded screen sessions as you explore through. Send any feedback to product@chartio.com or join us in our new slack community.
Lastly, if you’re as excited (or even one tenth as excited) as we are about this launch, do use the buttons below and share us out and let your friends, colleagues and community know! We’re working hard to show that Chartio is quickly inventing the next generation of data exploration!
More information
For more information on Visual SQL you can check out our product page, documentation, or our Visual SQL Transition FAQ. You may also be interested in reading our official launch post explaining much of the design story behind Visual SQL
