Real-time metrics can help you catch issues or capitalize on opportunities as soon as they appear. This tutorial will explain what e-commerce metrics you should monitor in real-time.
Why Measure in Real-Time?
For the most part, a deep understanding of your business and your customers comes from analyzing long term trends - aggregating months, or even years of data. This is what would inform your business strategies and roadmap.
However, metrics aren’t only for long-term and large scale planning. Metrics are also a powerful tool for day-to-day operations. For this use case, you don’t need, and in fact you don’t want, data that is aggregated over long periods of time. Instead you need real-time information. If there are situations that require instant action, then there should be a real-time measurement to identify the situation. Two critical applications for real-time metrics are:
-
To manage day-to-day operations
-
To catch sudden issues or bugs and react as quickly as possible
What E-Commerce Metrics Should I Monitor in Real-Time?
For real-time metrics to be useful, they have to identify a key opportunity or issue as quickly as possible and provide enough information to understand where the opportunity/issue is coming from. This section reviews some of the most useful real-time metrics for a typical e-commerce business.
Site Traffic by Marketing Channel
A sudden spike in traffic could indicate bots that should be investigated (more on bots) or could be an unexpected post that went viral on social media or a mention from an organization with a large following. Knowing the marketing channel of the traffic will make it easier to determine the source of the spike. Depending on the source of the traffic, you may want to take immediate action like blocking a bot if it’s malicious in the first scenario or offering a discount for new users to convert customers you wouldn’t normally see on your site in the more optimistic scenario.
On the other hand, a sudden decline in site traffic could indicate issues with your site that need to be investigated. Or if traffic is lower than expected, it could point to issues with your marketing systems - perhaps an email did not go out as expected, or there are issues with your site indexing impacting SEO. Again, the marketing channel will give very useful clues for figuring out what is behind the traffic change.
Another useful cut, especially to troubleshoot bugs on your site, is to look at site traffic by platform type (desktop, apps, mobile web).
Cumulative Daily Revenue
This metric is especially useful to monitor on your top revenue days to make sure performance is as expected. For example, say you’re monitoring cumulative revenue on Cyber Monday and comparing it to last year’s performance and by 10am the comparison looks like this:
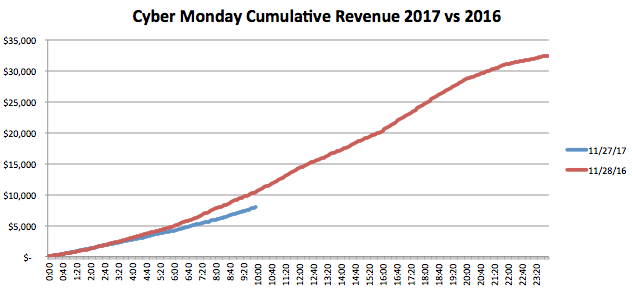
You’re clearly underperforming relative to the previous year. If this is not expected, you may want to consider altering your strategy to be more aggressive (dropping prices further, sending additional email/push notifications, etc…). Obviously it helps if you already have your plan B strategy ready to go so you can execute immediately.
Conversion Rate by Site Platform
While cumulative daily revenue is a great metric to monitor performance of a planned event, it isn’t very good at identifying sudden issues impacting your bottom line because the cumulative nature of the metric will somewhat mask a dramatic change for some time. However tracking your conversion rate (what percent of your traffic makes a purchase) will very quickly show you if something is keeping your customers from completing a purchase. For example consider this sample chart of the last four hours of conversion rate data:
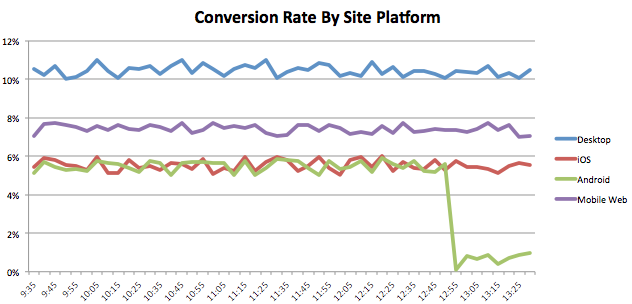
It shows a clear issue on the Android app. Splitting the metric by platform (desktop, apps, mobile web) will make it easier for you to diagnose the problem. You may also want to pair this data with your site traffic data. A sudden spike in traffic will often cause a drop in your conversion rate.
If you have key actions besides making a purchase on your site, you’ll want to track the conversion of those actions as well. For example, you can also track real-time email subscription rate or real-time account signup rate.
Site Speed by Site Platform
A sudden dramatic slow down is often a first sign of issues with your site.
Count of HTTP Errors by Site Platform
Similar to site speed, a sudden spike in HTTP errors could point to issues with your site. Here is a great guide of the most common HTTP error codes. However, not all HTTP errors are caused by your site itself. For example, a sudden spike in 404 errors (“not found”) could indicate a bad link shared in marketing materials that needs to be corrected.
Additional Considerations for Real-Time Metrics
How to Aggregate and Cut your Data
Metrics should be aggregated at the smallest time bucket that makes sense for your business. If you have millions of visitors per day, you likely have enough data to look at minute-by-minute data. However, if you only have a few hundred, you may have to aggregate more, perhaps at a 15-minute or even hourly level.
While the previous section provided specific cuts of each metric (marketing channel, site platform), you may find that your business needs additional cuts to be helpful for real-time monitoring. For example if you’re a global business, perhaps geographic cuts would be helpful.
It may take some time of monitoring your metrics and investigating when you see spikes to understand what aggregations and cuts of data are the most useful for your particular business.
Site Performance
While this tutorial covered a couple metrics related to site performance, your Engineering team should have its own list of real-time monitors on the performance of critical systems to catch issues before they start to impact overall business performance.
Conclusion
While each organization has its own nuances, the metrics covered in this tutorial give a great starting point for a typical e-commerce company to quickly identify issues or opportunities as they appear:
- Site Traffic by Marketing Channel
- Cumulative Daily Revenue
- Conversion Rate by Site Platform and by Traffic Channel
- Site Speed by Site Platform
- Count of HTTP Errors by Site Platform