Creating custom visualizations is an important step in unlocking the full analytical potential of your Google Analytics data. Specifically, area stack charts allow comparison of multiple groups of data over a set period of time.
Google Analytics offers an abundance of information related to the activity of your website. Not only is it important to have access to this data, it is also vital to analyze, visualize and gain insights in order to improve your web presence.
In this tutorial, we will look at some metrics in Google Analytics that can be visualized with an area stack chart. These charts are great for comparing multiple changing variables over time.
Google Analytics Acquisition
Tracking how users reach your website allows you to understand how your users come across your website and what channels drive the most traffic. Users reach your website through a variety of marketing channels. Google Analytics breaks down these channels into preset categories:
- Organic Search: User navigates to a webpage via organic search results
- Paid Search: User navigates to a webpage via paid search results
- Display: User navigates to a webpage via display advertising (Google AdWords)
- Direct: User navigates to a webpage directly from URL
- Referral: User navigates to a webpage from clicking a link on another website
- Social: User navigates to a webpage via social media outlets
- Email: User navigates to a webpage via email marketing
Breaking down visitors into these categories help show how visitors are accessing your website, and how well your marketing efforts in each channel are performing.
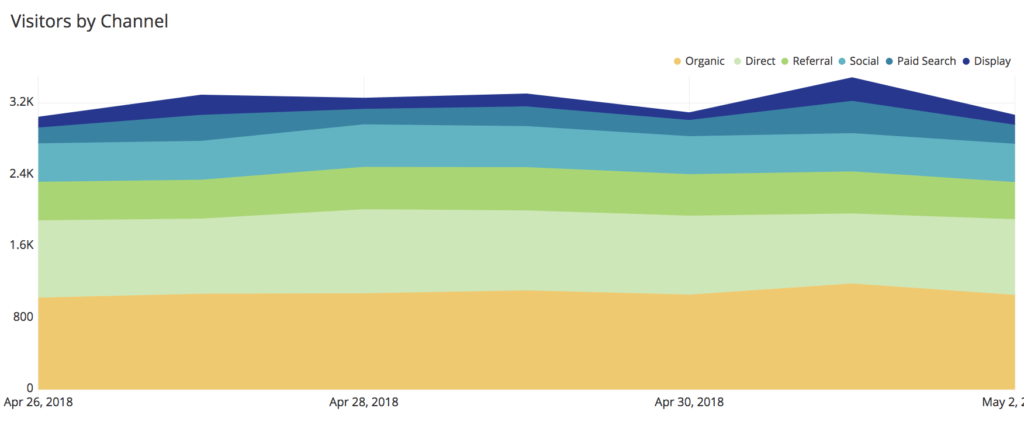
Since we have a small number of channels, we can track the performance of each of these metrics over time on the same chart with an area stack chart. This not only provides us with the information on how many users come to our website via each channel but also with the ability to compare each channel as time progresses.
Google Analytics does not provide a way to create an area stack chart with these metrics, but you can directly connect your Google Analytics account to Chartio and create an area stack chart as demonstrated here. You can also follow the steps outlined below:
- Connect your Google Analytics dataset to Chartio
- Click the Explore tab to begin building your chart
- Drag Id to the Measures section
- Drag Date and Default Channel Grouping to the Dimensions section
- Drag Date to the Filter section and select desired dates
- Pivot the data in the Data Pipeline
- Select Area Chart in the Chart Preview

Google Analytics Demographics
Demographics are essential in determining the web audience and potential customer base for your company. Knowing basic information like the age and gender of who is viewing your website allows you to model your marketing efforts towards a specific target audience.
Tracking the change in these demographic groups over time can show how certain marketing efforts are affecting who views your site.

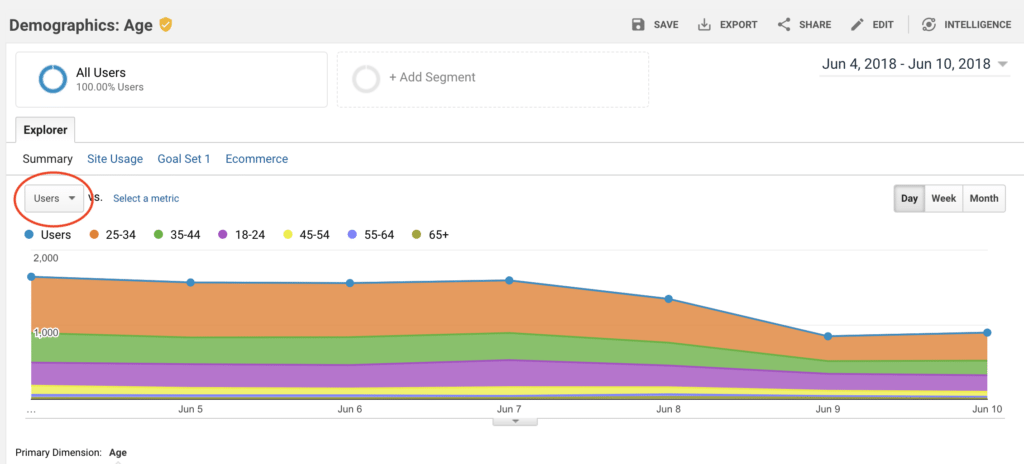
In Google Analytics, area stack charts are the default visualization for the Age and Gender demographics.
To access these pages in Google Analytics, open the Audience tab on the left side of the homepage. Under the Audience tab, there is a subheading for Demographics. From there, you can select Age or Gender to access a chart like the one above.
You can also change the metrics to display on the area chart by clicking the drop-down menu circled in red above. Notable metrics that are available to track include:
- Users
- Sessions
- Transactions
Google Analytics Device Categories
Google Analytics also allows you to track the device that is used to reach your website. Devices are separated into Desktop, Mobile, and Tablet categories.
Tracking the different categories of devices used to access your website can be vital for a number of reasons. As technology becomes more mobile, you may see the number of mobile and tablet visitors surpass the desktop users.
Having a mobile-friendly website is critical to ensure mobile users have an easy time navigating your website and the ability to make transactions. Tracking device categories helps determine if further mobile web development is necessary and if those improvements are helping drive engagement and transactions.
This is another example of data that can be represented by an area stack chart. Just like the Acquisition metrics discussed earlier, we need to use the Google Analytics data in another tool to be able to visualize this data as an area stack chart.
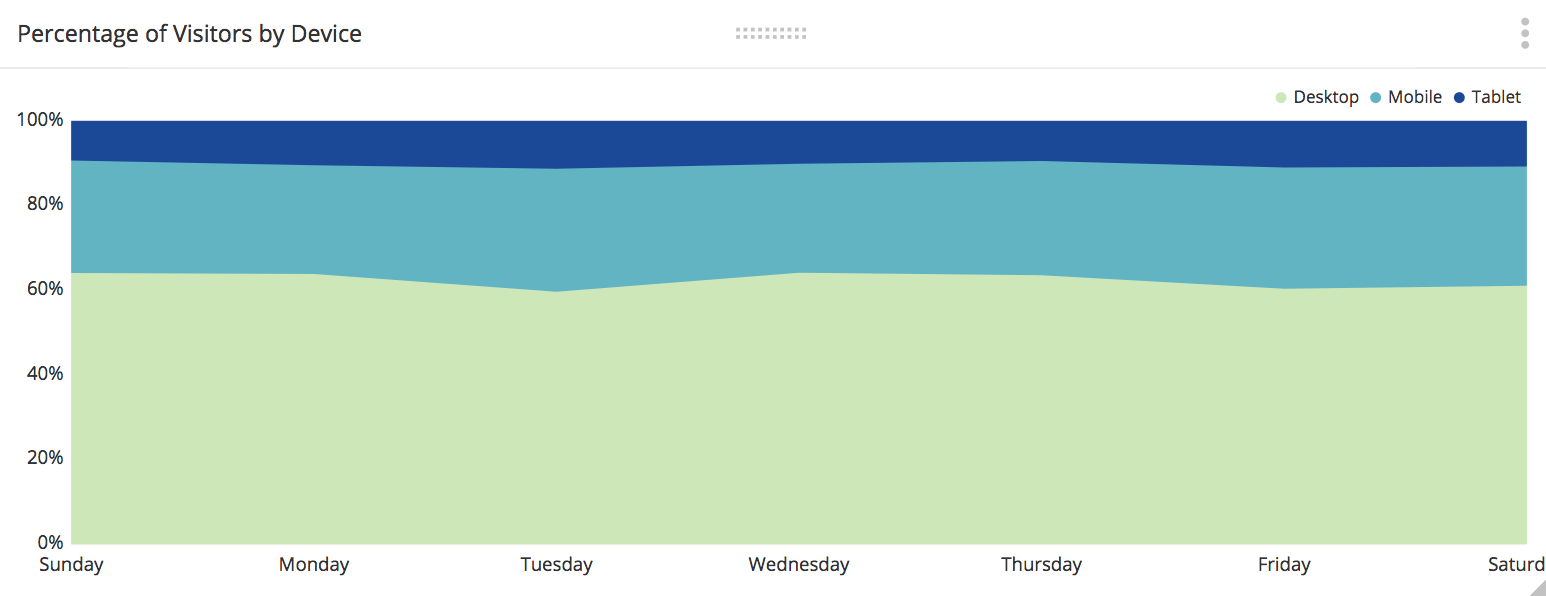
Here we have created an area stack chart visualization using Chartio. In this case, we have produced a variation of the area stack chart called a Parfait Chart. In this chart, instead of plotting the actual values, we plot their percentage of the entire set. The y-axis goes from 0-100 percent and is always filled in.

In this example, desktop viewers make up more than 50% of the visitors over time. It also appears that mobile users are starting to take a larger percentage of the visitors over time.
Conclusion
An area stack chart is a great visualization to compare multiple changing variables over a period of time. While Google Analytics has built-in standard visualizations, to get the most out of your Google Analytics data, you can use a more powerful analytics and visualization tool. Chartio can directly connect to your Google Analytics data, and provide a wider range of visualization options to customize your charts and dashboards.