A lead is defined as someone who actively engages with your SaaS product by providing contact information. Sometimes known as hand raisers, when a lead is created within your database, it means that the prospect has entered the marketing funnel.
Two business departments work together to move leads down the funnel: Marketing and Sales. Typically, it’s in Marketing’s wheelhouse to generate, or find demand, for leads and nurture them to a Sales Accepted Lead (or Sales Qualified Lead). Once that conversion has happens, Sales then can work with the prospect to eventually move them to being a customer.
Let’s use a data-driven Marketing team as our example. For this quarter, the Marketing team has an OKR (Objective and Key Results) of delivering 26,000 MQLs (Marketing Qualified Leads) this quarter.
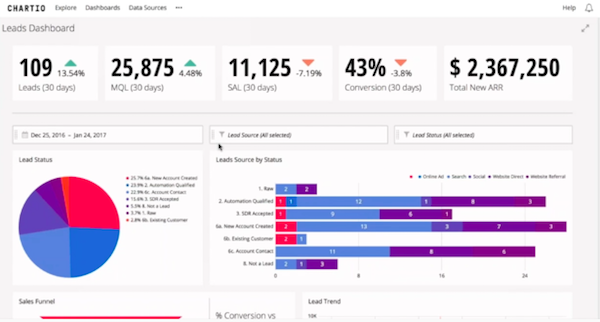
To ensure that the Marketing team’s efforts are on the right track, you can create a leads dashboard that tracks goal attainment, conversion, lead status and revenue.
How to Choose Metrics and Goals
Before you start to build your dashboard or combine your Marketing Automation data from Hubspot and CRM data from Salesforce, you’ll need to think about the question you’d like to answer via these metrics. Tip: Choose metrics that directly relate to your business and align with your marketing team.
For a Leads Dashboard, here are a metrics to consider that give you visibility into the health and status of your leads.
- Leads: the number of leads, with a 30-day rolling period, that you efforts has yielded for the Top of Funnel (TOFU)
- MQLs: the number of Marketing Qualified Leads the marketing team has delivered within the rolling 30 day period
- SAL: the number of Sales Accepted Leads within the rolling 30 day period
- Conversion: represented of as a percentage and indicates the health of the marketing team’s target audience and efforts
- Total New ARR: how much new Annual Recurring Revenue marketing has contributed to the organizations’ revenue
- Lead Status: tracks where leads are in the funnel and provides insights on where there is success
- Lead Source by Status: provides insights on lead status by source, so you know which channels are effective or needs improvement
- Sales Funnel: tracks each stage of the sales process via a funnel
How to Create a Leads Dashboard
A Leads Dashboard is a great example of a waterfall dashboard, which visualizes the cascading effect of the 26,000 MQL goal to specific metrics and KPIs across the Marketing team.
Leveraging your business data from Marketing Automation platforms (like Marketo or Hubspot), website data from Google Analytics and CRM data from Salesforce is crucial in powering an actionable CMO dashboard.
To create a Leads Dashboard in a data analytics tool, like Chartio, follow these steps:
- Identify the data sources that you’ll need (Marketing Automation, website analytics, CRM, etc.) and connect them your data analytics tools to power your metrics
- From your organization homepage in Chartio, click the New Dashboard button to create a new dashboard in Chartio.
- Follow the on-screen steps to name your dashboard and click the Add Chart button to create your first chart (metric)
- Most data analytics offer a SQL editor, where you can directly write SQL queries. Or, you can use the drag-and-drop interface to create charts
- Continue building out your dashboard by using the appropriate chart type for each metric
- Save and share your dashboard with your organization via a scheduled report or shareable link
- The Leads Dashboard will update in real-time, so you’ll always have a finger on the pulse of your business
Conclusion
A Leads dashboard provides high-level actionable insights into your marketing efforts and gives you visibility into goal attainment. This dashboard will enable you to make on-the-fly decisions and adjust marketing activities based on real-time data.