A funnel analysis is a very useful tool for Product Managers to understand the flow of users through their website. This tutorial will explain how build and understand a funnel analysis in Google Analytics.
What is a Funnel Analysis in Google Analytics?
Generally, a funnel analysis is a method of understanding the steps required to reach an outcome on a website and how many users get through each of those steps. The set of steps is referred to as a “funnel” because the typical shape visualizing the flow of users is similar to a funnel in your kitchen or garage. You can read a lot more about funnel analyses.
In Google Analytics, these outcomes are called goals. You can define many different kinds of goals. For example, a typical web commerce site would use the act of completing a purchase as a goal. You can see more examples of goals. In Google Analytics, any goal can be defined with a funnel of steps that lead up to that goal as long as the goal and the steps are all discrete tracked pageviews (or screenviews on an ap), which are referred to as “destination goals”.
In the example video, we are using the Google demo account which is of the Google online property, that sells Google-branded merchandise. Unfortunately, Google doesn’t provide demo users with admin permissions so you won’t be able to create goals or funnels in this account. But you can follow along to see how the funnels are defined. You can get specific instructions on creating goals here.
The goal in the demo account that is set up with a funnel is “purchase completed”. You can see how it was created by:
- Navigate to Settings - Goals.
- In Goal Setup, it was categorized as a Revenue goal that represents “Checkout complete (completed a purchase)”
- In Goal description, it was named “Purchase Completed” and set as a Destination type
- In Goal details, it was defined as reaching a destination page that contains the term “ordercompleted” within its URL. It has the funnel setting turned on and it configures four steps in the funnel:
- Cart: Reaching a page with the term “basket” within its URL. This step is set as required
- Billing and Shipping: Reaching a page with the term “yourinfo” within its URL
- Payment: Reaching a page with the term “payment” within its URL
- Review: Reaching a page with the term “revieworder” within its URL
How to View a Funnel Analysis in Google Analytics
Once your funnel is set up, it’s very easy to view the funnel visualization in Google Analytics. Simply navigate to the Conversions - Goals - Funnel Visualization report and scroll to the bottom of the report. If you want to follow along in the demo account, select the date time period Dec 1, 2017 - Feb 23, 2018.
How to Read a Google Analytics Funnel Visualization
While creating a funnel visualization is very straight-forward, understanding it is a little more complicated because it’s packed full of information.
From the video in the previous section, let’s focus on the top of the funnel.
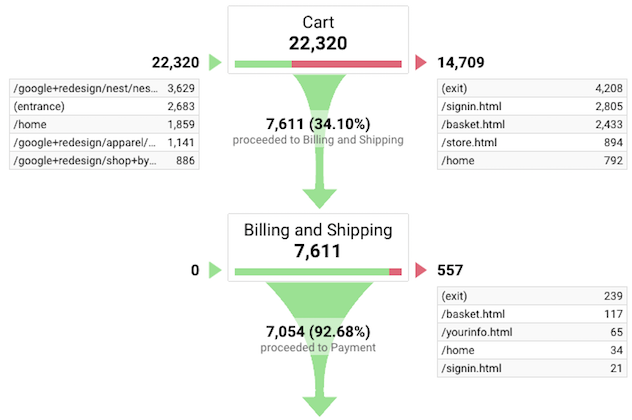
Breaking down down the image:
- The top left shows that 22,320 users entered the funnel, which means they reached the Cart step that was defined in the goals section.
- The table directly below that number provides the most common pages that led to entering the funnel. In this case the /google+redesign/nest/nest… page directed more users than any other page to the Cart, with 3,629 users.
- The top middle box for the Cart shows a bar at the bottom. The proportion of green represents the percent that went on to the next step in the funnel, while the proportion in red shows the percent of users that exited the funnel. In this case many more users exited than continued, hence much more red than green.
- Directly below this bar is the funnel graphic that shows that 7,611 users (which represent 34.10% of users who entered the funnel) continued on to the second step of the funnel.
- The top right shows that 14,709 users exited the funnel.
- The table directly below that number provides the most common pages after the Cart that aren’t in the funnel. In this case 4,208 users left the website altogether from the Cart step.
- The second step starts with the box for Billing & Shipping. Notice that the line below it has a lot more green than the one for the Cart step. This, as well as the wider funnel, are visual cues that we’re catching a lot more users in the funnel in the second step than the first. 92.68% of users in the second step go on to the third.
As you can see, the visualization conveys a lot of information. You can use this information to better understand where in the funnel you’re losing customers (in this case, in the Cart step). You can then investigate why that might be the case. You can use the exit pages as a lead to narrow in your investigation.
Conclusion
Google Analytics provides a very powerful funnel analysis tool to help you understand where your users are dropping off on their path to conversion.