Customer LTV (lifetime value) is a critical metric to understand the long term health of your business and the long term value of your marketing channels. This tutorial will explain what LTV is and how to measure it in Google Analytics.
What is LTV?
LTV refers to customer lifetime value. There is no exact definition because each organization measures “lifetime” and “value” differently. A typical definition for an e-commerce website would be the 2 year revenue per user.
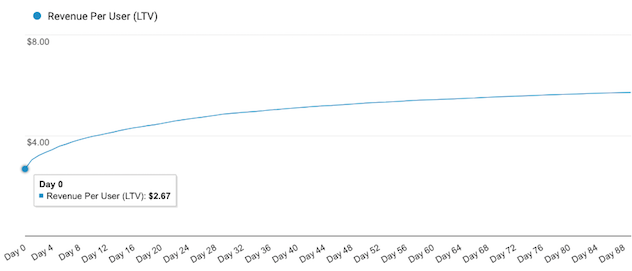
LTV is often represented by a line chart showing the cumulative value generated over time. The chart below shows a typical pattern for an e-commerce transactional business where a lot of value is generated early on in customers’ life cycle (represented by a steeper growth rate). Over time, less additional revenue is gained from the users as some churn (and the curve flattens out).
How to Measure LTV in Google Analytics
Google Analytics released a Lifetime Value report (still in beta) a couple years ago. At the moment, the definition of “lifetime” is limited to 90 days, which while quite constrained, still gives a great window into the early-on behavior of customers, especially useful for comparing different acquisition marketing channels.
In the example video, we are using the Google demo account which is of the Google online property, that sells Google-branded merchandise. If you want to follow along and have the data look the same, sign up for the demo account and in the date range in the reports select 3/1/2017 - 2/13/2018.
To view LTV report:
-
Navigate to Audience - Lifetime Value report
-
The top drop down allows you to select from different metrics of value. The default, if you have e-commerce tracking set up on your GA account is “revenue per user”, but other metrics that don’t require special tracking are also provided (for example, “sessions per user” - where the assumption is that there is value in the user continuing to visit the site over time).
-
The top chart shows the typical LTV chart of the metric you selected for 90 days
-
The table below summarizes the 90-day LTV by acquisition channel for the metric you selected. This allows you to compare how different marketing channels perform over 90 days. This is different that traditional Acquisition reports which evaluate performance of a channel in a single visit.
Refer to Google documentation to set up e-commerce tracking and/or goals in your Google Analytics account.
Conclusion
It’s important to monitor customer LTV to understand the long term health of your business and the long term value of your marketing channels.