Dashboard Design Best Practices: Finishing Touches
Posted by on January 6, 2016 Data Analytics
Now that we have covered best practices for creating a framework for your dashboard in our last blog post Dashboard Design Best Practices: The Dashboard Layout, this last post will cover how to make your dashboard a beautiful visualization.
White Space
The use of white space improves user comprehension. White space gives the eye a place to rest, so the elements on the page have more impact. Without white space, everything runs together and we can’t make sense of the dashboard.
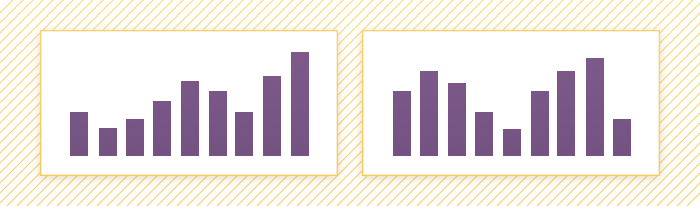
Use white space to keep your dashboard balanced between your sections and groupings of content. On Chartio dashboards, it’s usually helpful to leave at least one block of space between your charts.
Color
Color can draw the eye to what is important and tie together relationships. Color can also provide meaning to your dashboard
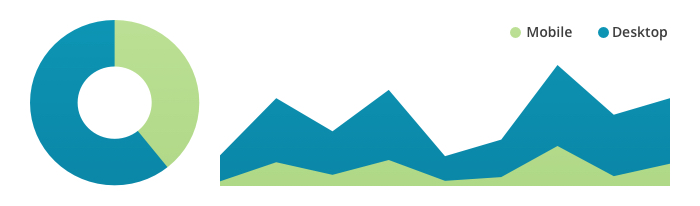
Color should be used sparingly in order to have the appropriate impact. Use earthtones and cool colors that are less distracting and natural. Use color to display meaning such as positive or negative change, categories, or importance. Keep in mind some colors can have different meanings in different cultures.
Typography
Text on your dashboard helps to provide context for your elements. In addition to axis labels and chart titles, dashboards can utilize headers, notes, and summary text.
Treat your dashboard text the same as you would treat your website text. It shouldn’t be distracting or hard to read. It should provide context and information, but it is not the star of the page
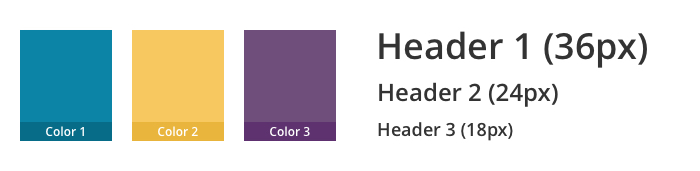
Create a hierarchy of importance by varying the size of text elements, but limit yourself to two or three different sizes, and keep these sizes consistent across the dashboard. Keep headers the same size, summary text the same size, etc. All text should be large enough to read.
Have restraint with color. In most cases, you will only need to use two or three different colors on your dashboards. Only utilize color for very important elements or for very specific context (positive change, negative change, alerts, groupings). Be mindful of the readability of text with color changes.
Good luck with your dashboarding!
In this three-part series we have given our best practices in dashboard design for presenting your most important company information.
We covered understanding the purpose of your dashboard, designing the dashboard layout, and the finishing touches on the dashboard’s appearance. We want you to have the best dashboard for your data. Good luck in creating your visualization!


