The 7 Types of Marketing Dashboards Every CMO Needs, Part 2
Posted by on July 5, 2017 Marketing Analytics, Marketing, Dashboards, Data Analytics
[Editor’s Note: This is our fifth and final installment in our “CMO’s Guide to Dashboards Blog Series.” In our previous installments, we highlighted today’s top marketing challenges, shared dashboard best practices in organization and design.]
This blog post is part two of our series on the seven types of marketing dashboards every CMO needs. Check out part one of the series.
Content Marketing Dashboard
As Content Marketing continues to grow, metrics provide insights in how content is performing. Taking a page from Jay Baer’s book, content marketers can track: consumption, sharing, lead generation and sales metrics all from one dashboard.
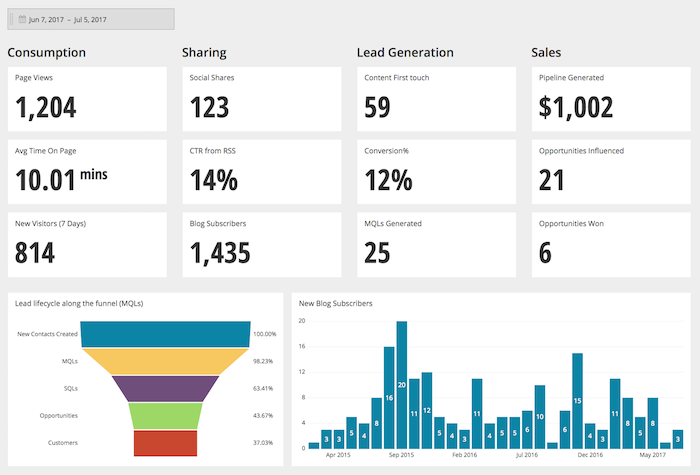
Consumption
- Page Views
- Average time on page
- New Visitors
- Bounce Rate
Sharing
- Social Shares
- Click-Through Rate from RSS
Lead Generation
- Content first touch
- Conversion
- MQLs generated
Sales
- Pipeline generated
- Opportunities influenced
- pportunities won
Since Content Marketing encompasses quite a few different types of content mediums (blog, gated content, video, infographics, etc.), be sure to organize your dashboard into appropriate sections.
The above example dashboard applies to a blog focused Content Marketing initiative. But many of these metrics apply when creating visualizations for gated content (eBooks, reports or white papers):
- New contacts created (Content MQLs)
- Landing Page Views
- Social Shares
- Content First Touch
- Conversion Pipeline generated
- Opportunities influenced and won
To create a full Content Marketing dashboard, you’ll need to connect data from your Marketing Automation, CRM, content management system, social channels and website analytics.
Web Analytics Dashboard
A web analytics dashboard focuses on your web analytics data, detailing specific numbers such as site traffic and time spent on site.
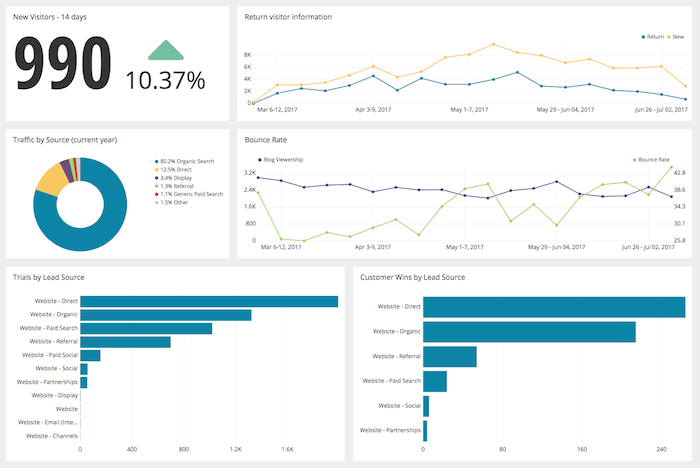
Metrics on this dashboard should include:
- Unique website visitors: Unique new visitors to your website
- Return visitor information: Even if a prospect didn’t convert on their first visit, it’s important to know that they came back
- Bounce rate: Tells you where visitors are dropping off, so you can better optimize the page or rethink strategy
- Trials by Lead Source: Traffic source where leads are coming from (direct, organic, paid, referral)
- Customer Wins by Lead Source: Tells you which source led to a closed deal ((direct, organic, paid, referral)
A website analytics dashboard gathers data from several different sources including website traffic, CRM, Marketing Automation, website optimization data and mobile analytics (if applicable).
Search Engine Marketing Dashboard
If you’re spending a lot of money on paid channels and search, chances are you’re going to want to meticulously track every dollar spent, so you know how and where you’re spending your money. As marketing budgets continue to fluctuate, the clearest way to prove Search Engine Marketing (SEM) value is through a dashboard.
Here are a few key metrics to track in your SEM dashboard:
- Customer Acquisition Cost (CAC): The cost to acquire a customer
- Top Performing Campaigns: A visualization of which campaigns are leading to the highest conversion, so you know where to focus budget
- Leads (from paid search): This metric is about accurately attributed leads to paid search
- Wins (from paid search): This metric is about accurately attributed revenue to paid search
- ACV (of wins from paid search): Again, aligning your paid search efforts with its impact on revenue
- Click-Through Rate: A high click-through rate is a sign that your keywords are working or your ad creative is working (or both)
- Cost Per Conversion: This metric allows you to answer the question if what you spent to acquire a customer is actually worth it to your business
- Cost Per Click: The cost that you pay for every click coming from a search engine
- Total Cost: The difference between how much money did you plan on spending and how much you actually spent
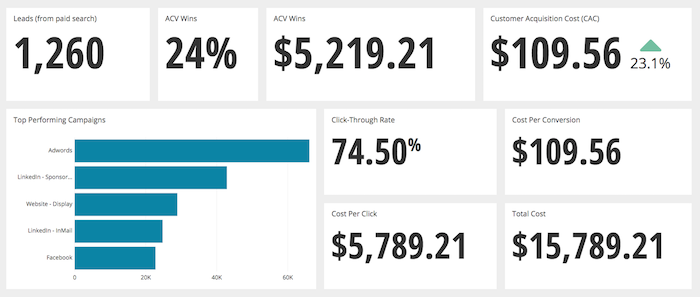
To create an optimal Paid Search dashboard, you’ll need to combine data from your website analytics, search engine data (AdWords, Bing) and CRM data.
Search Engine Optimization Dashboard
You can’t track SEM without tracking Search Engine Optimization (SEO) as well. Even though search engines continuously optimize their algorithms, it’s important to keep track of what’s happening on the SEO end of your website. Here are a few metrics to track:
- Organic Search Traffic: This can be a Single Value chart that measures the total number of organic visitors to your website
- Source of Organic Visits: Parse out the organic visitors by the search engine they’re using (Google, Bing, etc.)
- Conversion Rate: Percentage at which visitors are completing your conversion goal (requesting a demo, signing up for a trial, signing up for an account)
- Traffic-Driving Keywords: Know which keywords are generating the most traffic, so it can inform page content and your Content Marketing efforts
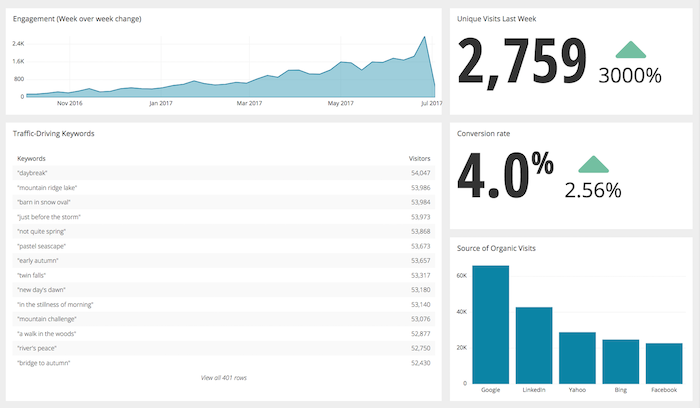
To create this SEO dashboard, you’ll need to connect data from your website analytics (Google Analytics, etc), advertising and CRM data to track prospects throughout the buyer’s journey.
Dashboards Drive Marketing Decisions
Today, Marketing is all about metrics. And the best way to continuously track metrics is through marketing dashboards. From insightful dashboards, know when and where you’re spending advertising dollars, understand what content resonates with your audience and determine which campaigns need to be suspended.
The invaluable insights surfaced from marketing dashboards can help your business grow exponentially, and can lead to finding new market segments, hyper personalization of messaging, iterating on paid campaigns, segmentation of your customer base, better attribution, and so on.
Data by itself can be dry, but dashboards bring the numbers to life by driving decisions and action. Secure your seat at the revenue table and implement marketing dashboards across your entire team, because today’s CMOs can no longer afford not to rely on analytics and dashboards.
If you missed any of our previous blog posts in this series, download our white paper, The CMO’s Guide to Dashboards.


