Practicing Good Data Hygiene with Your Visualization Tool
Posted by on October 10, 2017 Data, Business Intelligence, Data Governance
Practicing good data hygiene is crucial. Not only for data teams, but for every aspect of the business. From Data to Marketing teams, we all need good data hygiene. With that, practicing good data hygiene, first and foremost, starts with the data.
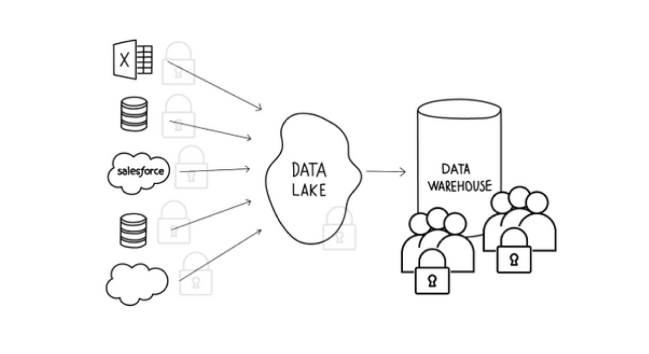
A few months back, Ben Perlmutter, Solutions Architect at Xplenty, wrote a great blog post titled The Importance of Good Data Hygiene — Data Lakes, Warehouses and Hygiene. In his post, Ben outlined the functional differences betweens data lakes and data warehouses and ranked one more hygienic than the other.
As a refresher, here’s how Ben (and I do agree) defines good data hygiene, “[it’s] essentially what you see in a well-organized data warehouse. In this scenario, I like to imagine myself wearing a white glove, running my finger along any surface inside the warehouse and seeing no dust collected on my finger. All the tables and relationships are well-ordered and organized, with common patterns for names and datatypes that make sense in relation to each other.”
Good data hygiene is what you see in a well-organized data warehouse. All the tables and relationships are well-ordered and organized, with common patterns for names and datatypes that make sense in relation to each other.
— Ben Perlmutter
With that, we have to admit that reaching 100% cleanliness—especially for large, messy datasets—is not always easy and even in some cases may seem next to impossible. That being said, good data hygiene is possible.
Data Aggregation is Like Washing Your Data Clean
In my two years as a Customer Success Engineer, I’ve never come across a customer that has had a decrease in their data. Instead, I’ve only ever seen customers increase their data. With this increase in data, I realized that if customers don’t address (either proactively or reactively) problems around data aggregation and hygiene—this could be a huge problem.
Simply put, raw data is dirty. Think of it as the equivalent to never washing your hands. There’s a lot of dirt and grime build up and the longer you go without washing your hands, the larger the problem (dirty hands).
That being said, connecting raw data to your data visualization tool is not good hygiene. When you bring raw data into your data visualization tool, you’re essentially bringing in all your tables, columns and fields into a tool that doesn’t necessarily need every data point from the beginning of time. You could have aggregated your data beforehand, or washed it off.
It’s important to note that if you’re purely working with Data Analysts, a majority of them are inclined to work with raw data and can efficiently make use of it. But, that’s only a small set of people as opposed to everyone in your organization.
So, if you’re serving your data to business groups (like Marketing or Finance) who are simply not as proficient in using raw data, not aggregating your data becomes a problem. Many business users don’t need to know all twelve columns of data when they only need to use three to get their chart.
With that, I recommend having two versions of your application database.
First version: Full schema database with all your tables and columns.
Second version: A version of your application database with aggregated tables that make sense (i.e. You combined four tables to create one robust table with all the pertinent organization information so business users can quickly get their data).
But what if you don’t have a problem yet? You can still optimize your database for performance. Here are two ways:
-
If you often run queries that have complex joins (i.e. one that requires multiple tables to be queried together), you can solve this problem by aggregating your database in advance
-
For organizations with tons of data, you can eliminate the data clutter and have more control by aggregating tables across the last 30, 60 or 90 days.
By aggregating your data and reducing the amount of columns for certain tables, you’ll be able to streamline data usage and lead business users on the right path.
Naming Convention is Your Soap
If aggregation is like washing your hands with water, then a naming convention would be your soap. And to get really clean hands, or data, you need both water and soap.
As a Customer Success Engineer, I’ve been fortunate enough to work with a lot of different customers and have been exposed to a lot of schemas, data tables, column names, etc. And, what I’ve learned during this experience is that people have bad habits when it comes to naming conventions.
Here are a few of the popular bad habits:
1. Appending table names
Ex: Zendesk Ticket Fields Ticket Fields Custom Field Options
The above is a real-life table that I saw in a customer’s Zendesk database. I’ve been working in Zendesk for over two years now, and I don’t even know what that means. My hypothesis is that the organization has appended tables so frequently that now the table doesn’t mean anything. This is really confusing.
My advice: don’t append tables names. Now is not the time to be lazy.
2. Using ambiguous names
Ex: ARR_1 vs ARR_2
People love using acronyms, shorthand and abbreviations - that’s great if you know what it all actually means, but if you don’t - it’s confusing. Also don’t just use a variant of the same acronym like above, ARR_1 versus ARR_2 - how are people supposed to know the difference?
Instead, be very specific when naming things and don’t use ambiguous names.
3. Not communicating with your audience
If you’re building out data tables for yourself or a core group of Data Analysts that are intimate with the data, this might not be such a high priority. But, if you’re moving towards a Decentralized Data Analytics model and have business users relying on the data, make sure you communicate with your audience.
4. Not implementing a data dictionary
One way to ensure that everyone is on the same page with your data tables and naming convention is creating a data dictionary, or a central repository of where you keep all your relevant data information, notes, explanations and use cases. This is both a guide and reference point to everyone in your organization. **Also a great place to spell out those acronyms, if you use them.
These four habits aren’t only applicable to your data, but also applies to how you name your dashboards and charts. So, just because you appropriately named your tables, columns, etc., great naming conventions should trickle down into naming conventions for anything data related.
Establishing Table Relationships is like Using Hand Sanitizer (for When you Need it)
What happens when you can’t wash your hands? You’re probably going to use hand sanitizer.
You can’t aggregate everything
A database holds a collection of tables, and for those tables you can establish relationships on how each table is used with another table. For a complex relationship, such as condensing a few tables, you can aggregate them. But, unfortunately, you can’t do that with every table.
To give your target audience (users) the best chance to actually use that data, you can set up foreign key relationships.
Establish foreign key relationships (when possible)
With establishing a foreign key relationship, it easily allows people to use raw data for their queries.
Don’t over complicate relationships
Just like hand sanitizer, you don’t want to abuse its power and over use it. If possible, I will always recommend that you go back to washing.
I’ve seen a lot of customers overuse foreign key relationships and it becomes a mess as there will be certain dependencies or certain queries will rely on a certain relationship, etc. To say the least, things get overly complex as the system gets abused.
If you see a problem where you have a lot of tables, and it requires a complex foreign key relationship, it’s worthwhile to aggregate the data and put it in its own custom table to avoid future unnecessary complications.
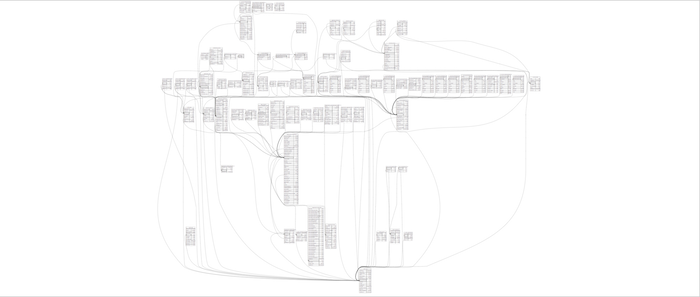
The image above is a complicated, messy and very overwhelming database. However, this database can be saved. By practicing good data hygiene, you can remove work to remove tables and simplify it.
Conclusion
Chances are we’ve always been told to practice good habits. Either by a mentor, a coach, a parent, a manager, basically everyone. This applies not just in our daily lives but in our data lives as well.
If you’ve practiced good habits, like washing your hands and preparing your tables, this will make it easier once it comes time to visualize your data.
When you practice these good habits it allows for the spread of those habits and increases the knowledge of data across your entire organization. So remember, washing your data—like washing your hands—is fun and leads to formidable results down the road.
For more tips on practicing good data hygiene, watch the full event video with talks from Xplenty and Chartio here.