Traditional BI Buzzwords for Modern Data Teams
Posted by on December 12, 2017 Data, Education, Business Intelligence, Data Analytics, Data Governance
About a year into Chartio, we’d moved into our first real office in the Founder’s Den. Another Denizen came by and said something to the effect of “Oh, you guys are in the BI space…” and then proceeded to drop about a dozen buzz words, only a couple of which I knew. I’d interviewed almost 100 companies about how their data processes and needs but at that point I realized I’d completely missed researching any vendors of the traditional BI market and the incredible amount of jargon that that community comes with.
As it turns out BI is an incredibly jargon filled industry as a result of it being historically so fragmented, with the largest players owning less than 10% of the market [1]. These giant pieces of software took months to install and integrate so trials were few and far between. Deals were won by one sales and marketing team out pitching another and often the tactics were simply to create more and more technical sounding terms to make your feature checklist look more impressive than another.
That day I started keeping a list of these buzzwords and after seven years of being in this industry, I believe I’ve heard most of them. I thought sharing a curated version of my list and definitions could be helpful in two ways:
-
Help modern data teams understand older/traditional concepts
-
Help traditional BI understand the modern take on these concepts
These are short and opinionated (probably controversial) descriptions. Many of these are still very relevant today, though may be described/branded differently. They are all so inner linked with each other, that I’ve found it easiest to list them alphabetically. If you find a term you don’t recognize in the description I’ve probably defined it further down the page.
BI — Business Intelligence
BI is short for “Business Intelligence” and is loosely used to refer to any system or process that allows a business to use its data to better do things. It’s an intimidating term and like Artificial Intelligence, the promise is huge but the results have historically under delivered.
Traditional BI systems typically involve a way to format data into a cleaner/faster format and then explore that data. Insights can then be saved as charts and dashboards.
Quite simply it’s a product that lets you create and share custom charts and dashboards of your data. Though the name implies a lot more, that’s what it is.
Business Analytics
Business Analytics is pretty much the same thing as BI. It’s just another term created by BI companies trying to sound a bit fresher/modern.
Ad Hoc Query
The ability to ask business questions on the fly. BI tools typically have pre-prepared reports, usually curated by the IT department. An ad hoc report allows a business user to ask a custom question (query) outside the scope of those pre-prepared reports. Because these queries can put strain on a company’s database, they are typically run against a data warehouse designed especially for analytical purposes.
Aggregation
Aggregation is a feature of OLAP that is equivalent to the SQL aggregation functions, such as SUM, COUNT, AVG, etc. For example, we could aggregate the value of all sales into a single number, total sales, by using a SUM aggregation.
Balanced Scorecard
There are suggested structures and a book around this term, but more simply a Balanced Scorecard is a set of performance dashboards for teams and individuals to monitor their performance toward certain goals. Today, this is most frequently called a KPI dashboard.
Big Data
This term has come in and out of popularity over the past 40 years. It meant various ambiguous things, but mostly refers to data that begins to reach the easily managed limits of our computing capacity. Such sets of data typically need extra consideration to work with.
Columnar Databases
The Columnar database (unlike its row-based counterparts) represents another class of technologies considered emerging in the BI space, though columnar stores have been around for some time. The following example illustrates the difference between row and column-oriented stores.
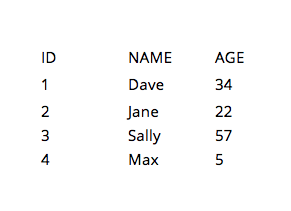
On the left is a very simple table as an example. A regular (row-based) database would store that data on disk (or memory) by row such as the following:
1,Dave,34;2,Jane,22;3,Saly,57;4,Max,5;
While a columnar store would organize the data by column.
1,2,3,4;Dave,Jane,Sally,Max;34,22,57,5;
Roughly speaking, columnar stores are better for computing aggregates (averages, standard deviation, e.g.,) over many rows of data that only include a smaller subset of columns. In other words, if the above example also includes the names of John and Jane’s family member, their social security number and their home address, a column oriented store would skip reading those values, whereas a row-oriented store query would be forced to, taking longer.
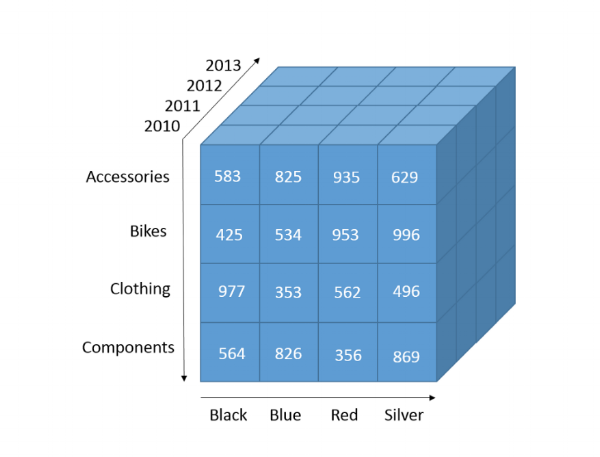
Cubes
Cubes are the building blocks of OLAP. They are a data structure in which business data, for example, sales data, are pre-aggregated along various dimensions. These dimensions might be Quarter, State, Employee, Department, etc. The advantage of using cubes is that because the data is effectively pre-processed, the query speeds are faster. So if an analyst wants to see total sales by quarter or by employee, the use of a cube will speed up the time to an answer. The disadvantage is that it takes a good deal of time to create and doesn’t perform as well on very large datasets.
DBA — Database Administrator
This is the original term for whoever managed your database. Before the cloud databases were a lot harder to maintain. So much of their job was setting up, configuring and maintaining a database, likely on their own hardware. The roles also included schema creation, data modeling, data cleaning, and query optimization. Perhaps because modern cloud databases need less “Administration” this term has fallen out of popularity. Modern companies tend to hire Data Engineers, Data Scientists and Data Analysts who all do some similar work.
Data Governance
Data Governance refers to all of the acts around cleaning and maintaining a sets of data and potentially a BI tool for individuals in your company to consume. You can think of this process as quality assurance for data.
Data Lake
Data Lakes are simply a messy pool where you keep data for a while before you organize/structure it. It may be on its way to a Data Warehouse or Mart or just being left around in case you need it in the future. Putting a bunch of data into Amazon’s S3 is a good example of a modern data lake.
Data Mart
Data marts are subsections of a data warehouse often used to organize the data into different sections for each business line, team or department. For some reason I’ve never liked the sound of this term but it’s an incredibly valuable idea. Often teams get overwhelmed by one giant warehouse with way more information in there than they need. It can be incredibly valuable to give your Marketing team a Data Mart with just their data, and your Support team a Mart with theirs. If everyone has access to everything it can be quite overwhelming to find and understand what’s important to your team.
Data Warehouse
A Data Warehouse is a database optimized for analytic processing on large sets of data. Data warehouses pull in information from across a business and store it in a way that is optimized for analytical queries through a process known as Extract, Transform and Load (ETL), a confusing concept which we explain separately. Common modern Data Warehouses include Amazon Redshift, Google BigQuery and Snowflake.
[Further reading] The Importance of Good Data Hygiene — Data Lakes, Warehouses and Hygiene
Data Wrangling
Similar to ETL (and often used to mean ETL as well), Data Wrangling is a term used when discussing cleaning and organizing data. This is sometimes done by a less technical crowd than those using pure ETL tools.
ETL (Extract, Transform, Load)
This refers to the three step process of getting data into a Data Warehouse.
Extract—pulling in data from across the business
Transform — manipulating the data according to certain rules and then loading it into a warehouse for analytics. This manipulation usually involves cleaning up messy data, creating derived metrics (e.g., sale_amount is a product of quantity * unit_price), joining related data and aggregating data (e.g., total sales across all stores or by region).
Load — loading this manipulated data into the Data Warehouse.
[Further reading] How to Choose the Right ETL Tool for Your Business
Drill-down
Drill-down is a feature of OLAP that lets business users explore data on increasingly higher levels of detail. This is equivalent to the use of WHERE clauses in SQL statements. For example, given total sales for the year, we could drill-down to see sales by store or given sales by quarter, we could drill down into sales by month.
HOLAP — Hybrid Online Analytical Processing
HOLAP is a combination of ROLAP and MOLAP that attempts to leverage the advantages of both approaches.
In-Memory Analytics
One of the bottlenecks in analytics is the speed at which data can be queried. One method for increasing this speed is to store the data in-memory. Storing it in-memory is faster, but more expensive than disk (hard drives).
KPI — Key Performance Indicator
A KPI is a metric of a key driver to a business or individual. If a business is driven by its customer satisfaction, or it’s signup conversion rate, then these are KPIs to the business. BI tools are very useful in visualizing these metrics so that companies, teams, and individuals can monitor their performance. This term is still commonly used today.
MOLAP — Multi-dimensional Online Analytical Processing
MOLAP is one of the two main types of OLAP. It is different than ROLAP in that the cubes are pre-processed and stored in their indexed form. The pre-processing can add more complexity and latency to your systems, but result in the fastest queries.
OLAP — Online Analytical Processing
OLAP simply refers to the types of queries done for analytic purposes. These queries differ from transactional (OLTP) queries in that they are complex, scan huge sets of data, take a long time, and are run infrequently. Typical modern databases for OLAP are the Data Warehouses Amazon Redshift, Google BigQuery and Snowflake. These databases are designed specifically to run potentially long queries on large sets of data in low volume.
OLTP — Online Transactional Processing
This term simply refers to queries that are being run for functional/transactional purposes. The queries that your product is using on your main production database are transactional. They are typically very quick queries that are run against a database at great volume. Typical databases for OLTP are MySQL and PostgreSQL. These databases are designed for high speed, high volume queries that your product will need to function.
Operational System
This just refers to your operational database. For example, the database your product is running on. If for example your product runs on an instance of PostgreSQL, that’s your Operational System.
Real-Time Data
It’s used very loosely. In its purest form it means that it’s live changing data. The charts change on their own as the data changes. Loosely though it’s used to refer to any data that’s less than 24 hours old.
ROLAP — Relational Online Analytical Processing
ROLAP simply refers to analytics through the use of SQL queries against a relational database. This is in contrast to MOLAP, which requires that data be pre-processed and loaded into a separate database for analytics.
Single Source of Truth
The Single Source of Truth refers to a Mart or Warehouse of data that is signed off as being clean, valid, and THE single spot that certain data should be retrieved. It is hard to build and maintain, but can greatly lessen the occurrence of data inconsistencies where two people may come up with a different number for the same metric.
Smart Data
I hear this term used with some frequency. I find it best to just slowly walk away from someone who uses it. You’re not going to find any value in that conversation. What does/did it mean? Nothing.
Suggestions?
Do you have any more buzzwords worth adding, or suggestions on the descriptions? I love learning new ones and will try to keep this updated with suggestions I get at dave@chartio.com.


