Every stage of a customer’s experience with a company can be viewed through the lens of conversions. After someone hears about us, did they end up buying? After buying, did they use the product? These are all conversions from one stage to the next. An understanding of conversion rates will allow you to optimize different parts of your business.
What is Conversion Rate?
Conversion rate is the percentage of people who take an action that achieves your company’s acquisition goals out of the total amount of traffic or interactions. It is the measurement that allows you to quickly see if a particular customer touchpoint is performing well.
Conversion rates are the standard by which we measure many key moments of a customer’s experience. For example, let’s look at every step when conversion rate relates to gaining a new customer:
- Seeing an ad and clicking on it
- Landing on a page and then providing their email address
- Going from providing email to starting a trial
- Transitioning from the trial to becoming a paying customer
A progression of steps or stages that a user moves through is referred to as a funnel, in this case it would be an acquisition funnel. At each stage of the funnel users either convert or not. There are more moments after acquisition where conversion rate is important as well, but acquisition is the main context. Conversion rates and acquisition funnels such as this go hand in hand.
How to calculate Conversion Rate
To calculate conversion rate, take the total number of conversions and divide that by the total amount of traffic or interactions on your offering. The most common formula for calculating conversion rate is:
Calculation example
Imagine a company is running an ad on Google for a new shaving razor. The company’s goal in this scenario is to have users click the ad to visit their ecommerce store. On the first day of the ad running, 100,000 users see the ad, 1,000 users click the ad.
From here we can calculate how well that ad is converting by taking the 1,000 clicks (conversions) and dividing that by the total number of views (interactions):
So the conversion rate on this ad is 1%. You will also see the conversion rates for ads called clickthrough rate (CTR).
This is a very abbreviated example, and it should be noted that you can delve a lot deeper into conversion rates. There are many factors which can affect your conversion rate past the first action that a customer takes, which we’ll cover below.
Best practices for Conversion Rate Optimization (CRO)
For any conversion rate you’ll likely want to optimize it to improve the business outcome you are driving towards. There are quantitative and qualitative ways to study how to improve conversion rates.
- Quantitative: A/B Testing, sometimes referred to as ‘split testing’, is the practice of creating variations of the customer touchpoint and splitting the traffic you are receiving to see these variations. A common example would be running two or more variations of the same ad but with a different picture or slightly different copy. You would then show half of your viewers one ad and the other half the other version. If the conversion rate is higher for a particular ad then you can turn off the other less performant ad.
- Qualitative: Use focus groups, in-person observations, or tools like usertesting.com to see where people get stuck and determine why they are not converting. Make sure the people you are interviewing and observing are within your target audience so that their experience maps to your customers.
Learning from quantitative and qualitative methods can help you uncover potential conversion pitfalls.
Visualizing Conversion Rate
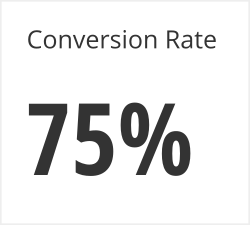
- Single value charts can clearly summarize conversion rates.

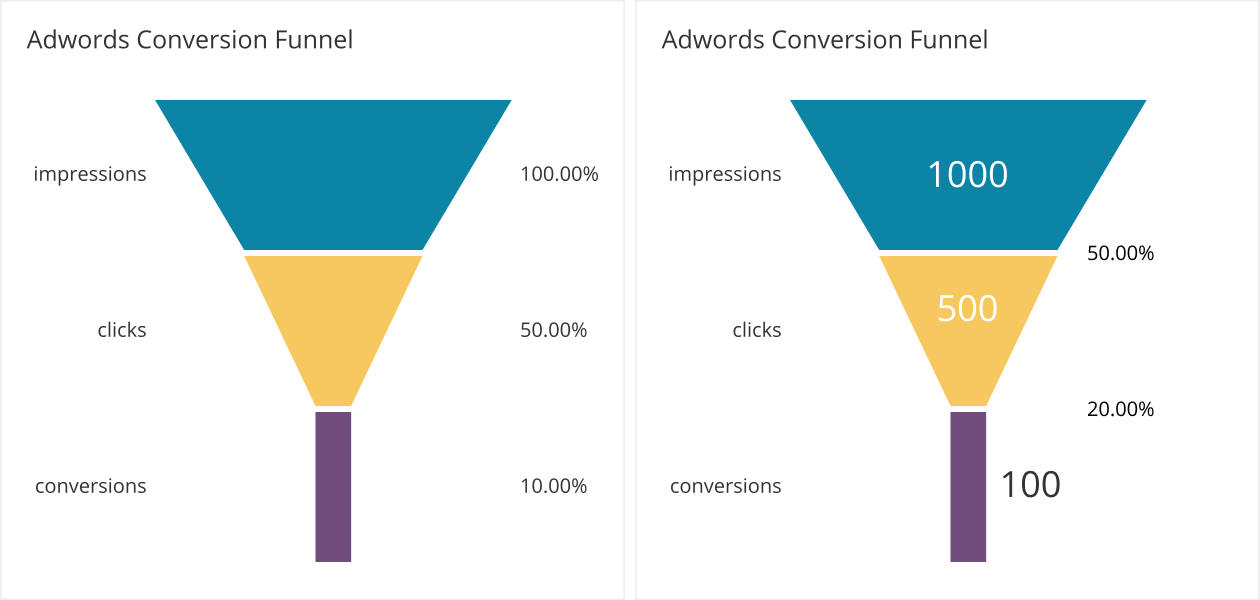
- Funnel charts can show us multiple conversion rates so we can see where people are not converting. We can either see what percentage of the total amount is at each stage or we can see what the conversion rate is from each stage to the next.

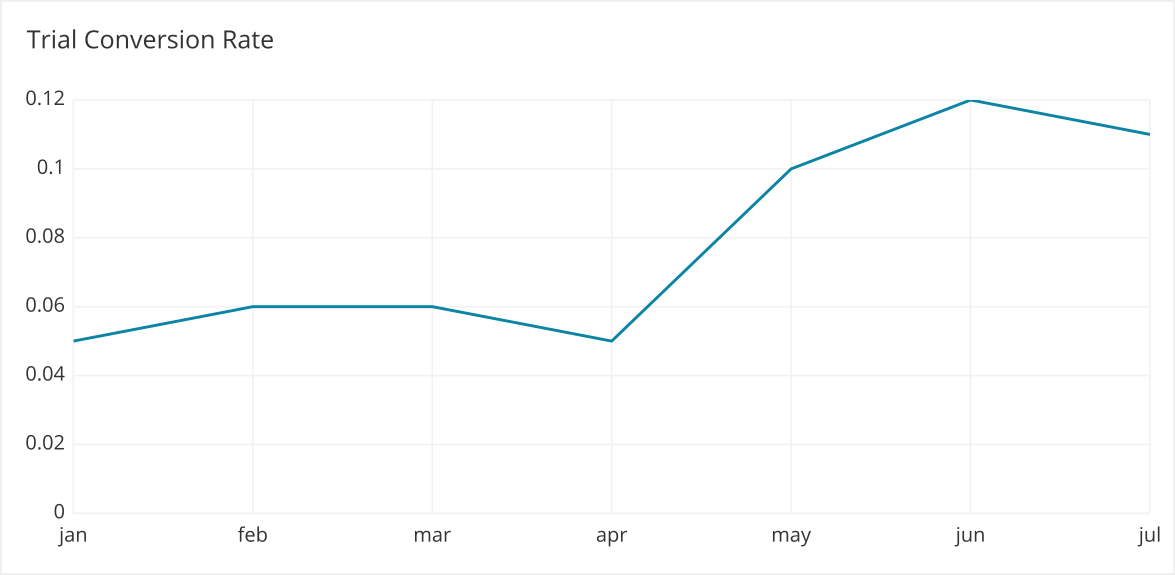
- Line charts can help showcase how conversion rate has changed over time.

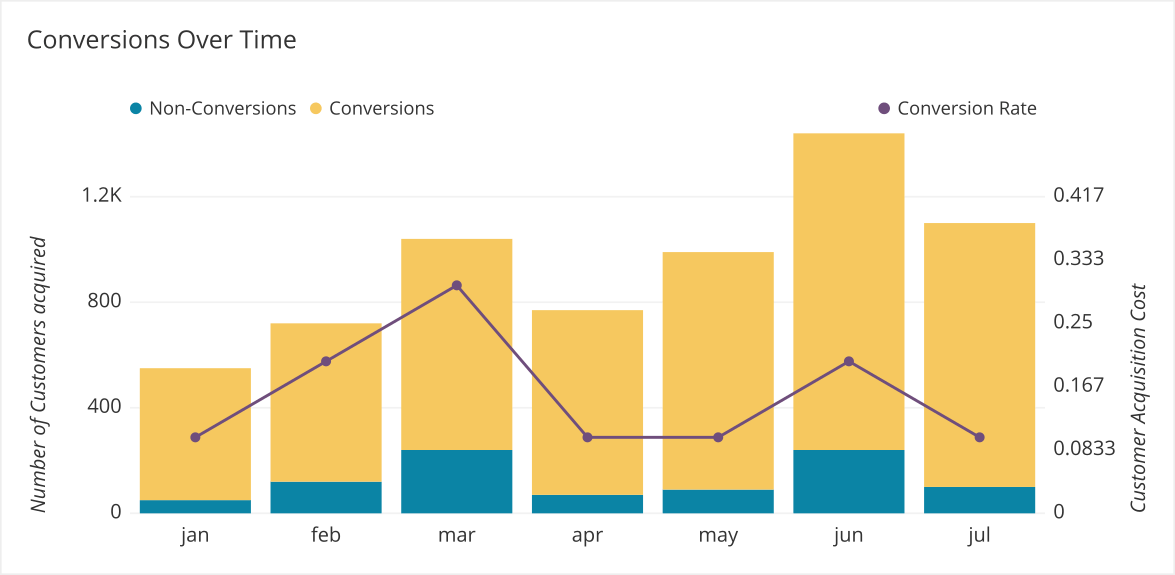
- Bar + line charts can help us see both the rate of conversion and the number of people converting.

The importance of visualizing Conversion Rate
Visualizing conversion rates make it clear when ads are more effective, UI is easier to use, and so on. Monitoring these rates help us understand more about the user experience.
Common misuses of Conversion Rate
It’s important to be mindful of how the parts of the conversion calculation are determined. One example is how an ‘impression’ can vary based on advertising platform:
- According to Google, an ‘impression’ is how often your ad is shown. An impression is counted each time your ad is shown on a search result page or other site on the Google Network.
- According to Facebook, an ‘impression’ is counted as the number of times an instance of an ad is on screen for the first time. (Example: If an ad is on screen and someone scrolls down, and then scrolls back up to the same ad, that counts as 1 impression. If an ad is on screen for someone 2 different times in a day, that counts as 2 impressions.)
These small differences in definition might cause you to come to different conclusions, so double check terminology when using a new ad platform.
Another common mistake is thinking that a high conversion rate means your ad is effective. While a viewer might click on an ad, they might not end up converting at the next stage of the funnel. Is your ad attracting people who are not actually interested in buying? If the conversion rate at the ad stage is high but the conversion rate of actually purchasing is low, make sure you look at each step of the funnel’s conversion rates to see where exactly people are falling out of the funnel.
Also segment your funnels for different channels so you can see if the conversion rates vary. This is very common and can help you identify marketing channels that attract the right type of person.
Variations on Conversion Rate
Conversion rate management is not limited to online businesses. Brick-and-mortar retail stores also benefit from conversion rate tracking. The calculation is the same, comparing total conversions against total interactions, but the form of an interaction is different. This has implications on how we should interpret a conversion rate.
One common form is a ‘door swing counter’, where a business counts the total number of ‘door swings’, or customers entering the business. This is their total number of viewers or potential interactions. They then use purchases ase their goal to be divided by the total views.
Online, when a person clicks an ad on Google, we gain a lot of information from just that one click:
- Type of device
- Browser
- Location
- Referring site
- Returning or new user
For a brick-and-mortar stores, there door counter is ‘blind’ to this kind of information. While a door counter is an indicator of location it does not provide insight into much else. This lack of metadata can cause the calculation to not be correct.
A customer can walk into a store multiple times and each is counted as a new ‘swing’ each time which could make the conversion rate artificially low. Additionally, a customer might arrive as a group. For example, a family of four might generate four separate door swings, even though that family might only make one purchase all together. This, again, will make the conversion rate artificially low.
Alternatively, if a bunch of separate individuals came in at the same time with a single held door, it could make the conversion rate artificially high. In fact, for this group you would have a conversion rate of over 100% if more than one of them made a purchase.
The way stores can respond to this potentially incorrect conversion rate is to measure success off of driving the conversion rate up across time periods rather than taking the conversion rate itself at face value. While the conversion rate itself might not be accurate, the behavior of visitors is assumed to be consistent over time so that the bias in ‘interactions’ is consistent.
Proxy metrics for conversion rate
Metrics that can affect conversion rates are still valuable in the absence of hard conversion data. Some are a bit more abstract than others, so interpreting that data might require an experienced industry veteran.
- Engagement metrics outside of direct conversion can give you a broad sense of conversion potential. Engagement examples include Facebook likes, claps on Medium, or views of your video on YouTube. While people are interacting, they might not directly convert, so judging the value of this engagement can be tricky. Expert guidance is useful in these scenarios to determine the impact of awareness and engagement.
- Email open rate is the rate in which your emails from a campaign are actually opened. While a reader may not have converted yet (moved from providing email to starting a trial) the open rate indicates they might be getting close. The higher your open rate, the more people are engaging with your content and brand. If you have a long sales cycle, this metric can be predictive of conversion.
- Cost-per-click (CPC) indicates the price you pay for a click on a pay-per-click (PPC) advertising campaign. Before you have any conversion data this number can signal if the campaign requires having a high cost product you are trying to convert on to be profitable. A higher CPC indicates a highly competitive keyword meaning it likely generates a lot of revenue when it converts; the price is bid up to a marginal cost that the highest bidders tolerate. While you do not know what the conversion rate will be, make sure you have appropriate margins when bidding on high CPC keywords.
Related metrics
There are many metrics related to conversion rate and, by understanding them all, you’ll gain a more holistic viewpoint of your product or service’s conversion potential.
- Clickthrough Rate (CTR) determines the percentage of people who actually click your ad, showing interest in your offering.
- Bounce Rate - The number of people who land on a page, do not take any actions, and then leave. This is useful track in order to see if people are not converting because on first glance they did not see what they wanted and left.
- Session length - The length of time a viewer is on a page can let you know how much they are reading/engaging with it. If you filter out bounces you can isolate only the people who spent time on your page. Taken in a ratio against the number of conversions, this can help create a more accurate version of your next conversion metric.
- Marketing Qualified Leads (MQL) - The number of people whose contact information fit your target market. It might be easy to get a lot of emails, but if they are not relevant to your product they will ultimately be worthless. This is an important number to track back to your ads to see if the ads are not only converting but producing marketing qualified trials.
Tools for measuring Conversion Rate
- Hotjar allows you to see how customers are interacting on your web page, showing where users are clicking and what they’re engaging in on your page. This is a great tool for A/B testing page layouts.
- Google Analytics is one of the most used tools in marketing, and for good reason. It provides a deep, insightful understanding of your site’s users. You can use it to see how you are converting on different keywords and from page to page.
- Heap.io captures everything your users do on your website and in your app, including clicks, submits, swipes, and views.
Conversion Rate case studies
- Hubspot (formerly Performable) changed their CTA button from green to red and increased their conversion by 21%! The color red has been shown to indicate passion and excitement, and it obviously paid off.
- CPU and GPU manufacturer AMD increased its social shareability by 3,600% by implementing a tool called ShareThis, giving site users the ability to share their news and content via various social media networks.
- Conversion Rate Experts helped Voices.com increase their conversions by 400% by demonstrating social proof, segmenting it’s traffic type into two separate pools, and creating demonstration videos.