Introduction
Product metrics can vary widely between different products and different industries. However, there is a common set of metrics that is helpful for almost any product. Selecting the right metrics to serve as key performance indicators is an important part of the product development process. Many experts advise making sure you have metric tracking in place at the time a product or feature launches.
Product metrics are often categorized into different groups. This can be a useful way to assess different aspects of how the product is performing. One useful and simple way to categorize product metrics is to split them into two groups: economic metrics and engagement metrics.
Product Economics
Economic metrics measure things that impact the profit equation directly, such as revenue or costs. Product leaders rely on these metrics to assess the quality of marketing efforts or the viability of the business model. Below is a list of five of the most important economic metrics.
1) Conversion rate
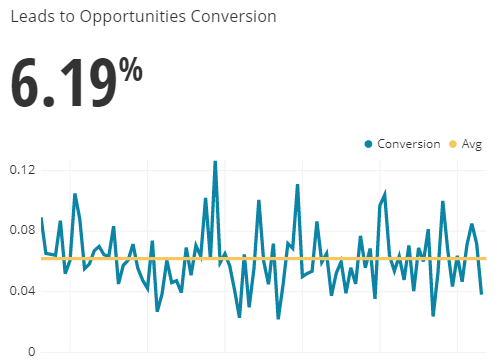
Regardless of the product or company, customers go through a set of steps, called a funnel, towards a certain goal. The conversion rate measures the percentage of users who make it from one step to the next. This could be from a product page to checkout page or from new customer to repeat customer. The conversion rate is calculated simply by dividing the number of users in the latter stage by the total number of users in the previous stage (e.g. checkout page visits divided by product page visits). For web-based products, the conversion rate is often called the click-through rate (CTR) since users are clicking from one page to the next.
2) New customer growth rate
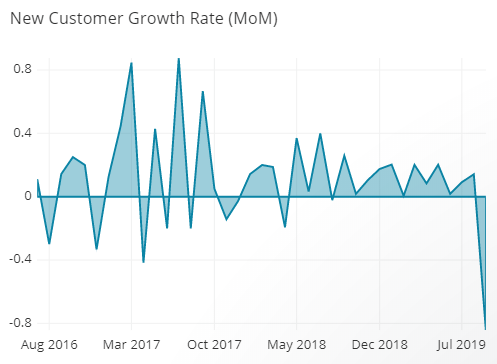
New customer growth measures the number of brand new customers a company acquires. This is a useful measure because it differentiates between new and repeat business and is a leading indicator of future growth. New customer growth rate is measured by taking the difference in customers from one period to the previous period, then dividing by the number of customers in the previous period. For example, if we went from 800 customers in one month to 900 in the next, then our customer growth rate for the month would be (900-800)/800 = .125, or 12.5%.
3) Churn
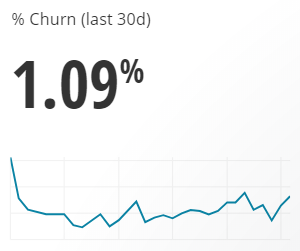
Churn is a commonly used metric for measure subscription businesses and consists of the percentage of customers that a company loses during a certain period. This is calculated by dividing the number of cancelled subscriptions in a period by the total customer base. Minimizing churn shows that your product matches up well to the needs of your customers.
4) Cost per acquisition
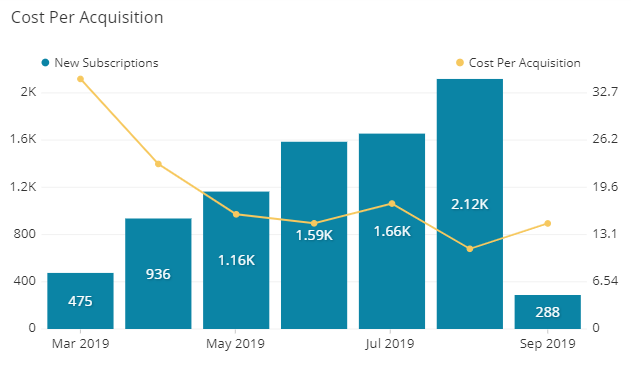
Cost per acquisition(CPA), or customer acquisition cost (CAC), measures how much it costs to acquire a new customer. This is generally measured closely by the marketing team, but it’s an important product metric as it impacts pricing decisions. Your price must exceed both how much the product or service costs to deliver but also the amount spent on acquiring the customer. It’s measured by the total direct marketing costs for a specific product divided by the number of new customers acquired from those efforts.
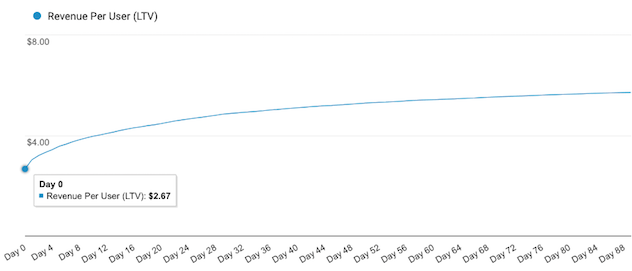
5) Customer lifetime value
Customer lifetime value (CLTV) measures how much value the average customer is worth to the company. This is calculated by dividing the average lifetime spending per customer by the average cost to service a customer. For example, for a subscription company, you’d multiply the subscription margin (price - variable cost) by the average subscription length to calculate the average gross margin generated by one customer. Take a look at this post to learn more about CLTV.
Product Engagement
Engagement metrics measure how customers or users interact with the product. These metrics should provide a picture of which parts of the product are working or not working. Product leaders rely on these metrics to understand the value that customers derive from different aspects or features of the product. Below is a list of five of the most important engagement metrics.
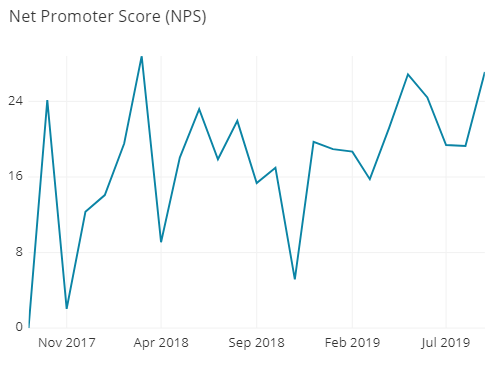
6) Net promoter score
Net promoter score (NPS) is one of the most popular metrics across industries. It’s a measure of how likely customers are to recommend your product to others. NPS is calculated by first surveying customers on how likely (1-10) they are to recommend the product to others. Once you have the data, you simply subtract the percentage of detractors (responses of 6 or lower) from the percentage of promoters (responses 9 or 10). Take a look at this post to learn more about NPS.
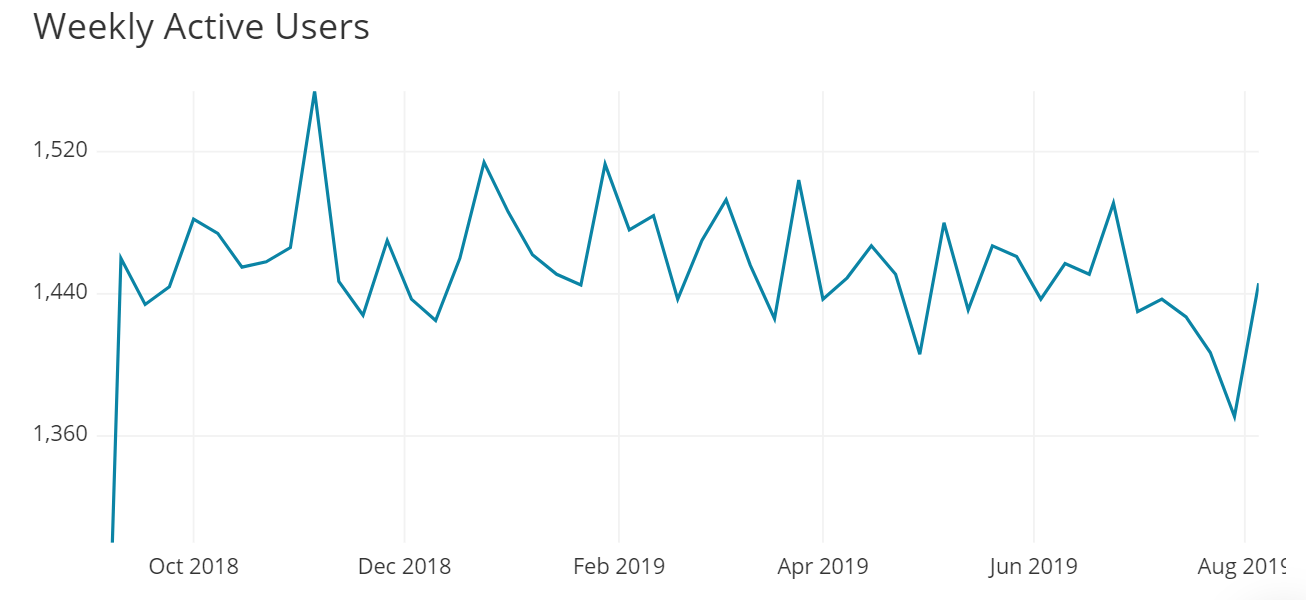
7) Active users
Active users measures the number of users who actually use the product during a certain period. Many companies measure the total number of accounts for customers, but active users gives a more accurate measure of a product’s user base. The optimal time period for measuring active users, such as daily or weekly, depends on how often a user is expected to use the product.
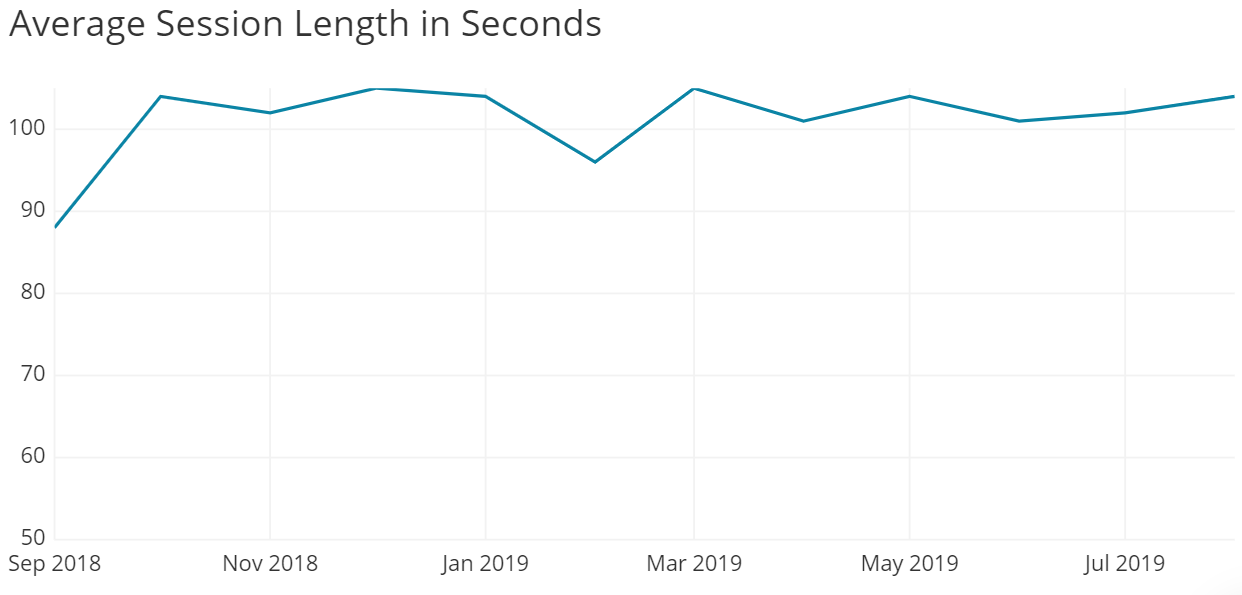
8) Session length
Session length measures how long a user typically uses a product at a time and provides insight into how much a user enjoys the experience of using the product. To calculate session length, you first calculate the session length for all sessions by subtracting the start time from the end time. Then you take the average of all session lengths within each period. It is common to remove sessions that are shorter than a few seconds since these may be accidents by the user or be bots crawling your page or app.
9) Number of sessions
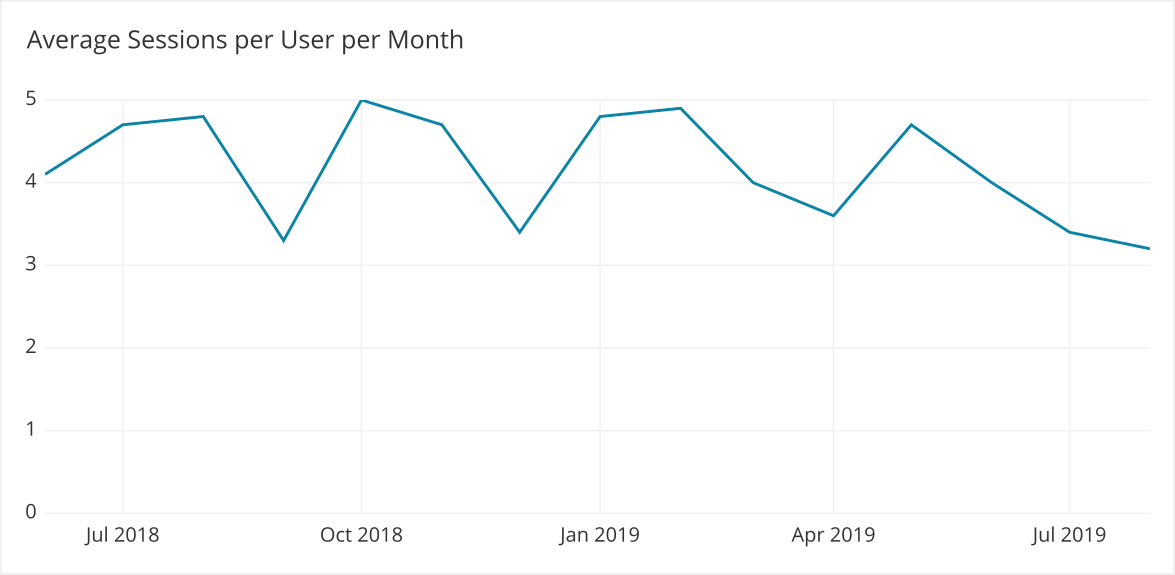
The number of sessions measures how often users use the product in a given period of time, generally the same time period as the active users metric. Like session length, it can give insight into the stickiness of the product and how important the product is to the user. If the number of active users or their number of sessions is low, then the product may not be capturing user needs well.
10) Feature usage
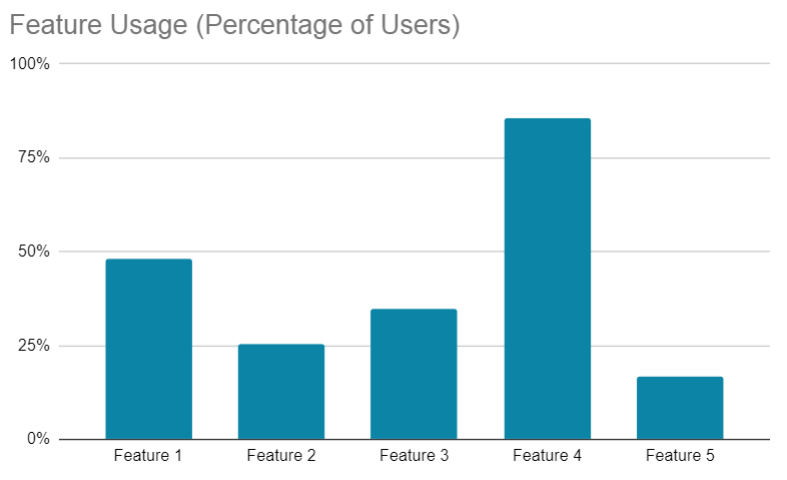
This metric measures the percentage of users who use different product features. This can help product leaders prioritize the features that are most important to users and potentially remove or deprioritize features that aren’t used. To calculate feature usage for a given period, divide the number of users who used a feature by the total number of users. This post goes into more depth about measuring product feature usage.
Digging Deeper
This set of product features becomes even more powerful as you segment the data and take a more granular view. How does session time vary among different customer segments? Which regions have the highest customer lifetime value? How do mobile conversion rates compare to desktop conversion rates? Knowing the answers to these types of questions can help product leaders make more data-driven decisions.