What is Average Session Length?
Session length is the amount of time a user spends on your website or app during a single session. Average session length is the sum of all session lengths divided by the number of sessions in a given time frame.
Average session length is a way to measure engagement. When someone uses the app, are they leaving right away or are they spending time using it? This data can be combined with other indicators such as looking at what actions they are taking so that you know if your website or app is providing the user value.
How to Calculate Session Length
To calculate session length, you need to be able to track exactly when a user starts using an app and when they stop using the app. This is determined by tracking the first event when the app loads or you land on the web page and the last event which might be pressing a “Quit” or “Close” button, or the last interaction they performed before idling out due to inactivity.
The formula is:
Session length is typically reported in minutes and seconds. If the user started the app at 10am and the app became inactive at 10:12am, the session length is 10:12 - 10:00 = 12 minutes.
To get the average session length, we need to sum all of the individual session lengths in a timeframe and then divide it by the count of the sessions of that time frame:
For instance, you might have 10 sessions during a given day. The session length for these individual sessions are 10, 5, 2, 5, 6, 3, 4, 8, 5, and 10 minutes. In that case, the average session length for that day would be:
As you might imagine, this becomes difficult to calculate manually with an increasing number of users and when you want to look at changes in average session length over time. Marketers and analysts tend to depend on their preferred analytics tools to run the numbers in real time and gain an accurate average for this KPI.
How to Visualize Session Length
Single Value Chart
A great place to start in your visualization efforts is a single value chart in your dashboard that simply shows the raw statistic. You can enhance that chart with an additional number and symbol to indicate how much higher (or lower) that number is compared to the previous time period.
Line Chart
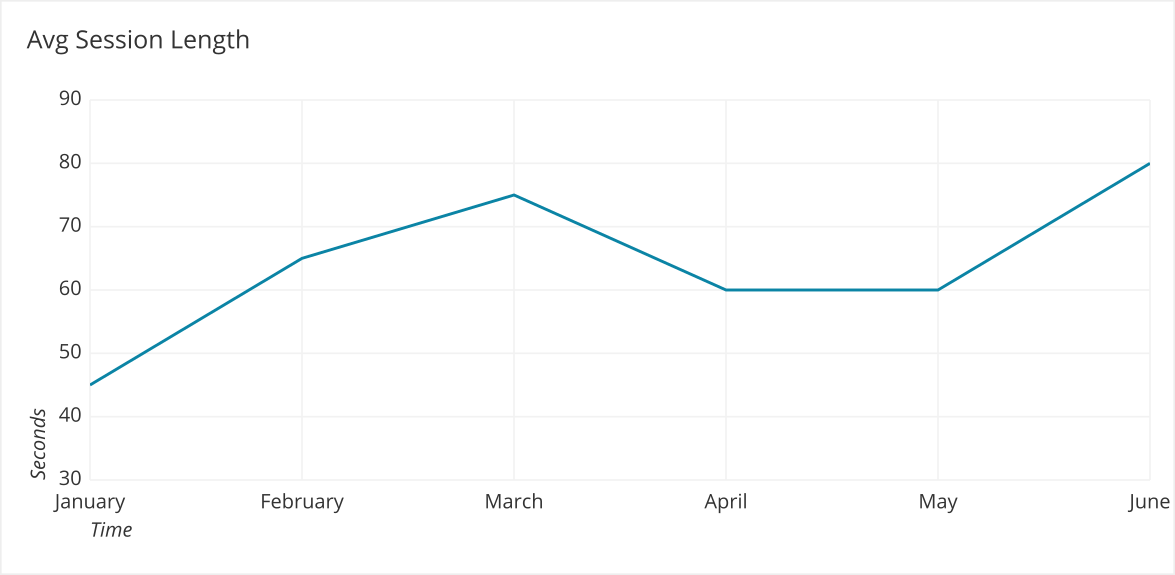
A line graph allows you to visualize how average session length changes over time. This helps expose trends and identify outlier periods. It is particularly helpful if you annotate the line graph when changes to the website or app were made.

Histogram
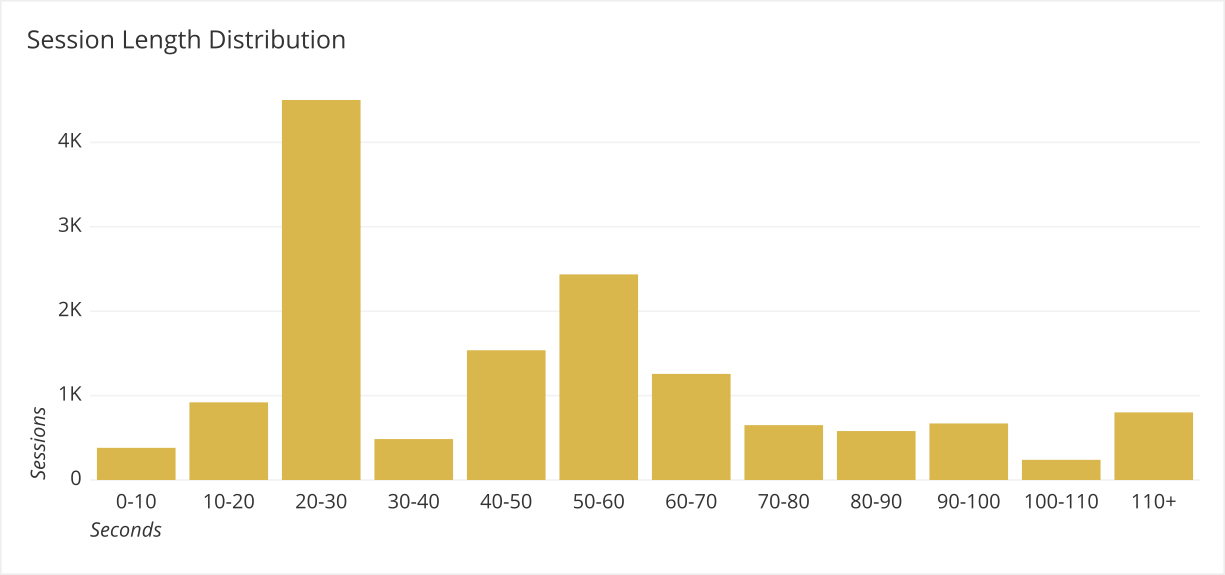
Finally, you can use a histogram to go beyond the basic average for deeper insights. Each bar in a histogram corresponds to a particular session duration (such as 20-30 seconds), and the size of the bars show the number of users that fall into each range. It’s a way to better understand the average and where your individual users skew.

Best Practices for Using Average Session Length
Watch out for Outliers
Beware of using average session length as it is given, since there may be outlier session lengths of both extremely long or short length. As mentioned above, it is a good idea to visualize the histogram of your session length data to see if there are any unusual points that should be discounted or viewed with caution.
Be sure to check for 0-length sessions. 0-length sessions might occur when a start or end session event is not sent or logged. You should investigate the users actions of 0 length sessions to track down the issue. If they are due to errors you may want to remove these records from any summary statistic calculation.
Use Industry Benchmarks
Metrics like average session duration are more beneficial if you have something to compare them against. This might be a previous period showing growth or decline, but industry benchmarks are an even better way to determine how successful your app is in engaging its users.
For instance the average mobile user spends about five minutes on a given app. However, that number can go up or down significantly based on the industry; gaming apps demand significantly more time, while simple functionality apps don’t take nearly as much. This comparison is critical to investors who have seen this data across many companies in their portfolio and in pitch decks.
3 Common Misuses of Average Session Length
While this metric is undoubtedly beneficial in many ways, it can easily be misused and actually lead to misleading insights as a result. If you don’t avoid these pitfalls, you might draw false conclusions and drive your app the wrong way. On the other hand, avoiding these pitfalls increases your chance of actionable takeaways that drive app (and business) growth.
- Longer is always better. In reality, apps like password generators or keyboard features will benefit from shorter durations. Long sessions typically mean confused, unhappy users who can’t find what they’re looking for. Taking this type of absolutist approach, without keeping your goals in mind, risks drawing the wrong conclusions from app session duration.
- Turning session length into a core goal. Session length is a great engagement metric, but this KPI should not be an end in itself. It’s an indicator of engagement, not the sole measure of engagement. In isolation, turning session length into a core goal might mean simply increasing the length of processes rather than making the app itself more engaging or useful.
- Computing session length on a user-based fashion. Sessions are defined by closely-connected periods of activity, rather than just taking all of a user’s activity in a period. Confusing that fact may lead you to misconstrue any takeaways you have from this metric. A social networking app, for instance, may see multiple short session durations as a single user just checks for updates multiple times during the day.
Proxy Metrics to Determine User Engagement
While session length is undoubtedly valuable, it’s far from the only metric helping you to track and evaluate your users’ engagement with your app. Perhaps the closest variation of this KPI is the total time an average user spends on your app per hour/day/week/month, which takes that continuous caveat mentioned previously in this article out of the equation and is measured by the user, not the session.
Other relevant metrics that get to the same goal of user engagement include:
- Total number of active users (daily or weekly).
- Session interval, the time between two sessions for an average user.
- Screen flow, which measures the success of individual screens within your app based on visits, time spent, and app exits.
- App retention, or the percentage of users who come back to the app after using it over a defined period of time (usually 30 days).
None of them get to quite the same conclusion as session length, but they’re valuable additions to gain insights into the big picture. Together, these KPIs can help you understand how your users are using your app, where you need to improve, and what successes you can build on.
Tools for Measuring Your App’s Session Length
To effectively measure and analyze this metric, you need two components: the ability to actually collect user session data, and a data tool that helps you automate the formula above and visualizes the result.
Google Analytics is a popular tool to gather information on app usage and session length. Other options, like Mixpanel, offer similar services in simply hooking into your app and drawing the relevant data out of it.
For visualization, you need a tool that allows you to easily build real-time charts such as bar graphs, and line graphs. If you want to avoid manual data point plotting, you need a tool that can do it for you. Chartio, which allows you to build digital charts based on calculations in the background, can be that solution. You set the data points or integration, and the visualization builds itself.
Through this tool, you can build a dashboard of user engagement metrics that provide valuable insights into overall app success. Let’s talk about the ways you can integrate session length into your data analysis, and drive your business forward as a result.