What is Session Count?
Session count is a record of the number of times a user visits your website within a given timeframe, such as day, week, or month. A cookie on the visitor’s browser is used to track the user’s activity between the time they enter your domain and the time they leave.
Sessions create a record of all the interactions each visitor has on your website, including all the pages they view and the engagements they make with events, calls-to-action, forms, etc. Session data can be analyzed to better understand user behavior and it can be used to create the criteria for an active user metric.
Session Count Criteria
New sessions
In Google Analytics, and many other tracking tools, the default session expires 30 minutes after the last interaction. This means that if a user leaves a page open and then comes back within half an hour, the two visits will be recorded as a single session in the session count.
However, if the user exceeds the 30-minute limit before coming back on your website, it will count as two separate sessions. The length of time before a session expires can be customized to be as short as a minute, or as long as several hours.
One point to consider is that sessions will end at midnight due to the start of a new day, and a new session will be created. This could have a minor effect of overcounting true sessions on day boundaries.
Browser
In addition to exceeding the time limit, any pageview by the same person from a different browser will be counted as a separate session regardless of when it is viewed.
Example of calculating session count
For a better understanding of how to measure session counts, let’s look at a hypothetical user’s activity on a website:
| Time | Browser |
|---|---|
| 1:00pm | Chrome |
| 1:29pm | Chrome |
| 1:31pm | Safari |
| 2:02pm | Safari |
The total session count would be 3 even though this is one user on the same day.
- Since the first two visits are on the same browser and within 30 minutes of each other it is counted as one session.
- The third visit, while within 30 minutes of the previous visit, is on another browser. The original cookie cannot track that it has been here again and this is counted as a separate session.
- The fourth visit is over 30 minutes after the third visit on the same browser so it is counted as a separate session.
How to Visualize Session Count
In many instances, no one session visualization method can perfectly capture all the elements and aspects you wish to focus on. You need to use them in combinations. Here are a few practical ways of visualizing the number of sessions:
Single value charts
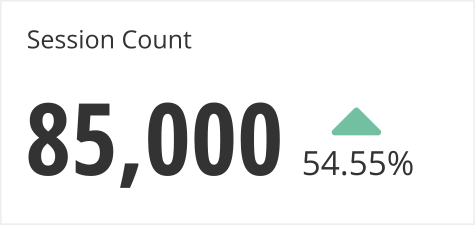
Single value charts quickly convey the current session count for a given amount of time. The time period is typically set to day, week, or month, unless it is visualized to track progress towards a specific goal such as a quarterly OKR. It is also common to provide an indicator as to how much this session count has changed since the previous time period.

Line charts
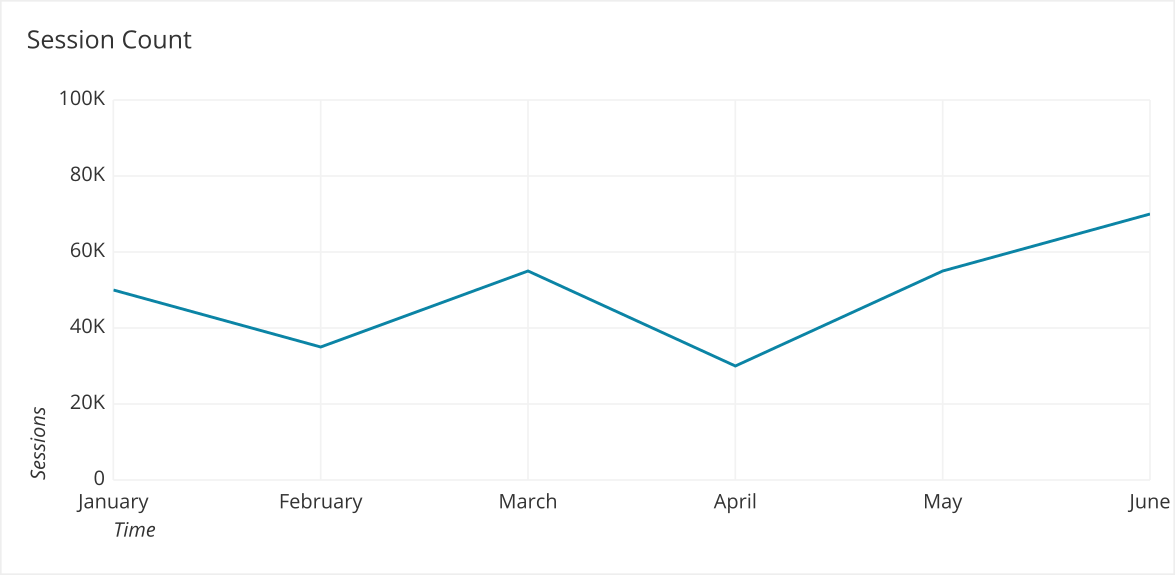
Line charts are used to measure session count over time. This chart is usually also next to a line chart showing unique user counts and sessions per user metrics to give more context to these numbers.

Common Session Count Misuses
Session length change
One common way planners misuse session counts is to change the session timeout settings without documenting when the change was made. By default, sessions last 30 minutes. If, for example, you reduce this to one minute, your session count will probably increase, and you are likely to erroneously count what should be a single session more than once. When this value is changed, previously collected session count data will no longer be directly comparable since the definition of a session will have changed.
New session surprises
Session count is a fairly reliable metric, but there are ways that errors can occur. For example, session counts can be duplicated in unexpected ways such as during brief internet disconnections. It is important to realize it is likely not 100% accurate but it does provide a high level understanding of user behavior.
Ad blockers
Tracking users with ad blockers are one of the biggest challenges digital planners and marketers face. When a user is using an ad blocker, it means you are not able to track their session activity on your website so the data may not represent these visitors accurately. You will want to use other supporting metrics such as views, and unique users to complement your understanding of session count.
Combined with the previous point’s concerns, it might be better to de-emphasize the use of session count as a complete count of user activity on your site. Instead, it is better to focus on the change in session counts over time.
Related Metrics
Some of the metrics related to session count include:
- Average Session Duration: Shows the average amount of time users spend between their first and last interaction on your website. This provides another dimension of information on how users engage with your site. Taking session count and duration together, we can see if people are visiting frequently but in short bursts, or relatively infrequently but for longer.
- Pages per Session: Another way to measure engagement from session data is to look at how many pages the average user looked at in each session. While duration gives you an idea as to how much time was spent on the site, pages per session lets you know how much of the website or app was explored. This can provide insights into the effectiveness of your navigation.
- Heatmaps / User Tracking: While not a metric per se, you can set up tools such as HotJar to track where the user is moving their mouse, what they are highlighting, and what they click on during a session. This data is recorded in video format and then summarized into heatmaps to see where the most people interacted with your web page or application.
- Bounce Rate: Shows the percentage of your user base that landed on your page and took no actions before exiting. This will not count as a session since no actions were taken. This number is a good measure of if the content on the page matches the expectations of the headline or ad that the user clicked on to get there. If the bounce rate is high, it indicates the page contents are not what the user is looking for.
Conclusion
Session count is a high level metric that gives you insight about engagement on your website or application. Due to its tendency to not be 100% accurate, the best way to use session count is to track relative change over time. Session counts are best used along with other metrics in a dashboard such as number of unique users to better understand user behavior.