Roadmap to 2021: What's Ahead for Chartio
Posted by on August 6, 2020 Chartio

At Chartio, our roadmap is driven by a combination of our mission and customer input. We are here to enable a future where anyone in a company (not just the data teams) can explore and understand their data. For data to truly empower a company it must be accessible to those who know not just how to work with the data technically, but also those who know the business context of the data. With the support and feedback from our amazing customer base, we continue to deliver the feature sets that propel our customers into becoming informed businesses.
Last week, I joined AJ Coppa, our Director of Engineering for a product roadmap webinar providing our community with a quick recap of the features and updates delivered year-to-date as well as a peek at what’s coming in the second half of 2020.
Fast, easy data exploration and collaboration fuels H1
In the first six months of 2020, Chartio delivered over 63 releases. I’m so impressed with the velocity coming from our product and engineering teams. Despite our remote distribution due to COVID, we’re delivering features faster than ever.
Here’s a quick overview of the major releases:
Visual SQL
In March 2020, we released Visual SQL - the #1 interface for exploring data. Visual SQL allows anyone at a company to easily query data, no matter how familiar they are with SQL. Instead of having to memorize or Google the SQL syntax, users can simply click, point, and easily type queries with Visual SQL. From there, Chartio does the work. This makes data exploration easier and faster for both technical and non-technical users.
I’ve been a long-time user and avid fan of SQL, but now I’m a Visual SQL convert – using it every day. Why? Because it’s much faster to make query changes, rather than wasting time Googling date formats, or typing by hand long JOIN statements!
Our Visual SQL journey is just beginning. We have a great foundation, but more improvements are coming out weekly. We have big plans to deliver improved foreign key support, additional pipeline steps, easily customizable join paths, and more!
Chart comments
In March, the world was thrown into a new way of working. Conversations that typically took place at cubes or in conference rooms were now shifted to Zoom meetings and Google Hangouts. When it became apparent that we’d all be working remotely, we quickly put together a task force and built a new level of collaboration into Chartio which led to the launch of chart comments. With chart comments, users can have conversations around their data in real-time without having to leave Chartio. I can speak to our use case internally and will tell you – it’s changed how we work.
Read our blog and docs to learn more.
Interactive Embedding
 In May, we released Interactive Embedding. You may be thinking, “Wait! Didn’t Chartio already offer embedding?” Yes, we did. We just made it more awesome and more user-friendly for our customers.
Chartio’s embedded visualizations are now fully interactive, giving viewers the ability to dig deeper into data with just a click, tap, or hover to get more information.
If your Chartio dashboard includes native UI elements like dropdowns and date selectors, those features now function just as well when the dashboard is embedded. In other words, our embedded dashboards now work exactly as they would in Chartio. You can read the full announcement here.
Permissions API
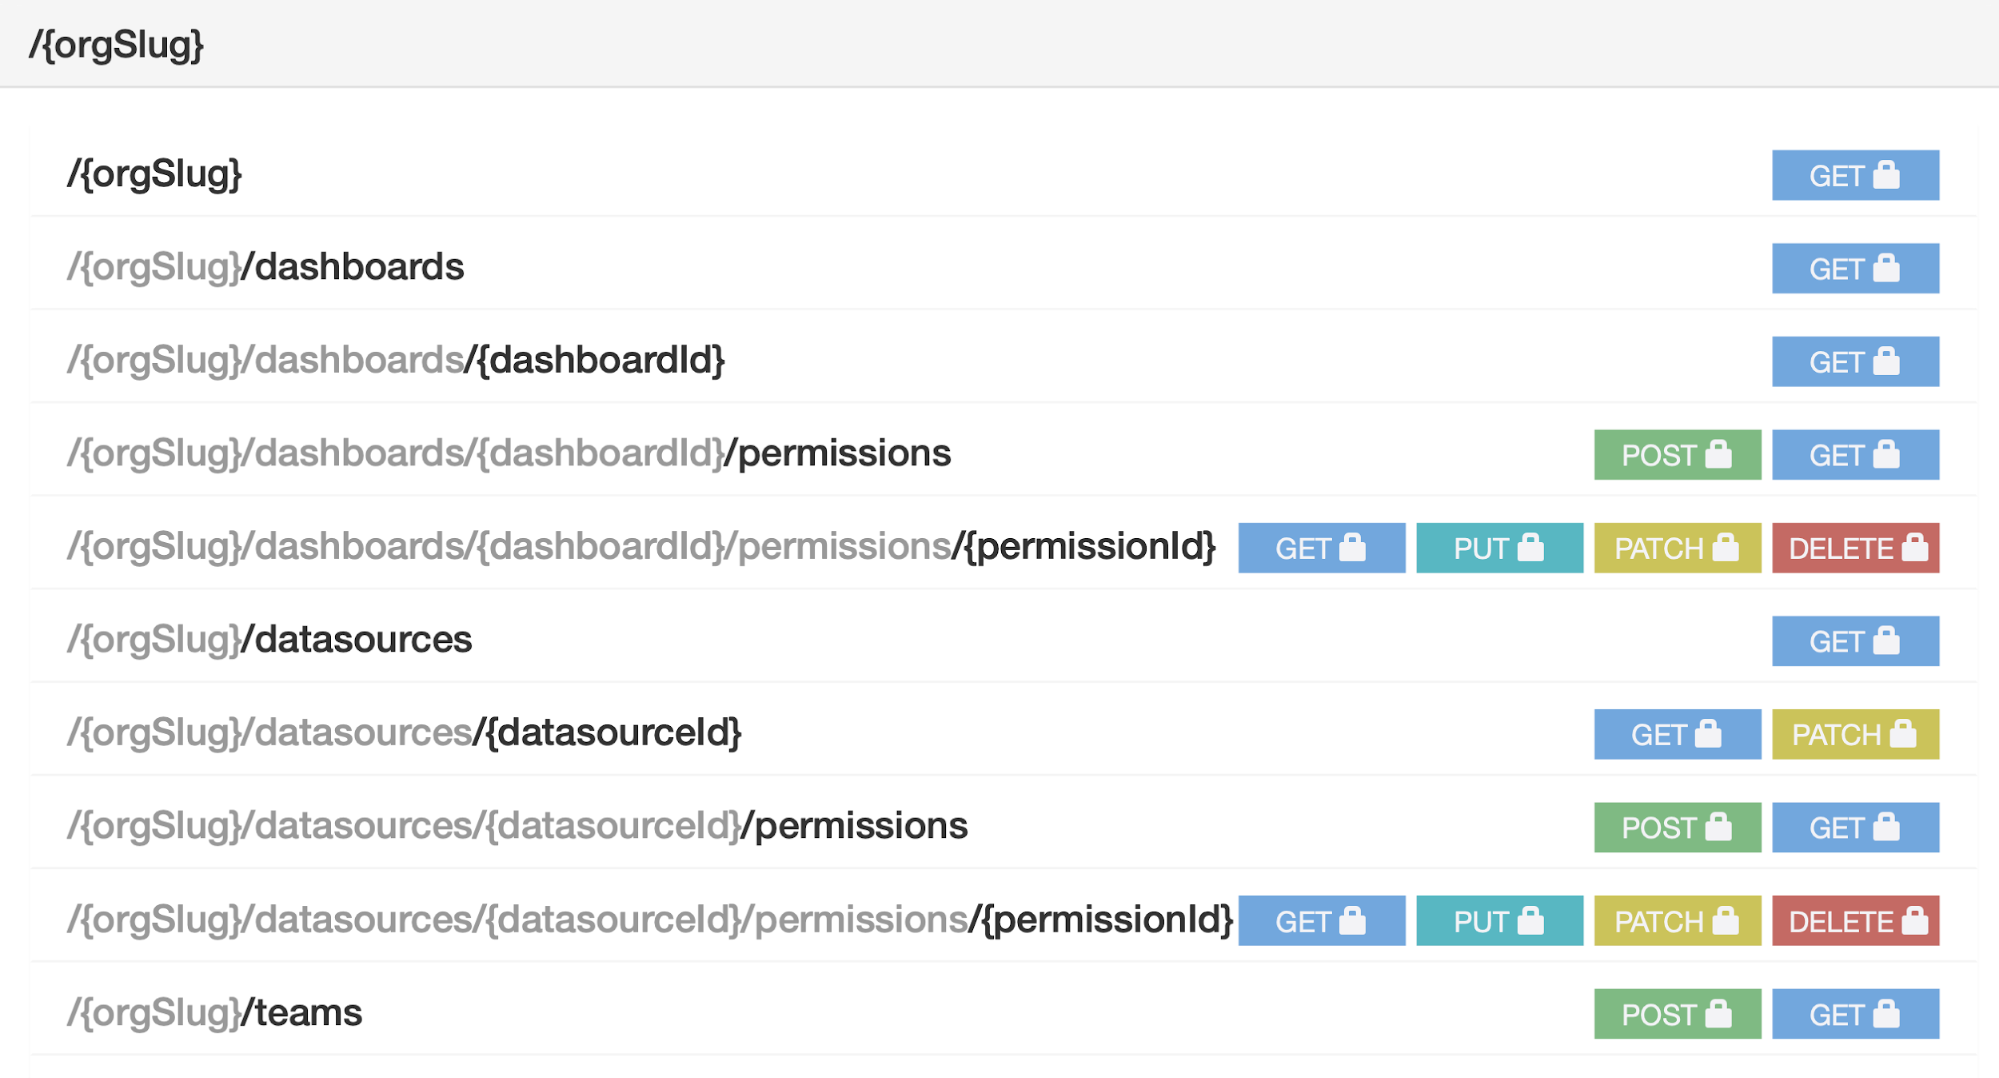 Hey Chartio Admins! This one’s for you. We’re committed to making sure managing your users in Chartio is a frictionless process. We want you to have the control you need but not have it be a burdensome, time-consuming process. With our upgraded Permissions API, which launched in June, Chartio customers can now easily manage users, teams, dashboards, and data sources without any headaches.
Some customers need to be able to easily manage who can see what dashboards and tie it into their internal systems. With our new permissions API, customers have the control they need to manage that however they want.
For more of an in-depth overview please check out our blog announcement and documentation.
Here’s what’s coming in H2 2020
The first step in strategizing and developing the Chartio product roadmap is to talk to our customers. As I mentioned during the webinar, we want to help our customers solve problems and so we base our roadmap on providing them solutions to do just that.
Here’s what you have told us:
- Chartio needs to be easy to use for both advanced SQL users and business users who are not familiar with SQL.
- The visualization library should be extended and improved to make more settings available for users.
- Changes in databases should be able to sync to Chartio easily.
- Continue making Chartio easy to use!
That feedback shaped our second half 2020 roadmap. Here’s what’s coming:
Easy data migrations
Data administrators, another one you’re going to love.
This project will improve your ability to sync Chartio with schemas in your databases. In addition, users will be able to find whether a table or columns are being used in Chartio easily and quickly.
This feature will help administrators anticipate how changes to their databases might impact their dashboards, charts, alerts, and data stores in Chartio. And retroactively, it will make it easier to track the impact of those changes, so admins can more quickly address any issues that might arise.
New Visual SQL features
While Visual SQL has proven extremely popular, we’re still at the beginning of our journey. We continue to run user tests to identify key areas for improvement. The engineering team is already working on a variety of projects including: more pipeline steps, easier JOINs, better foreign key support, and more. We’ll continue to keep you updated as new features and upgrades are released.
Our goal is to continue to make this interface the best in the market. We’ll be releasing more and more features, so keep an eye out.
A better SQL experience
Based on our own data, we know that a lot of our customers love using SQL mode. If you’re one of those customers, you’ll be delighted to hear that you’ll be able to enjoy the new and improved SQL editor very soon!
The new SQL editor will come with a full screen editor, improved autocomplete function, and unlimited history feature, where users can track all the changes and jump back to the previous version as needed.
Be on the lookout for an email announcing this update soon!
New visualization library
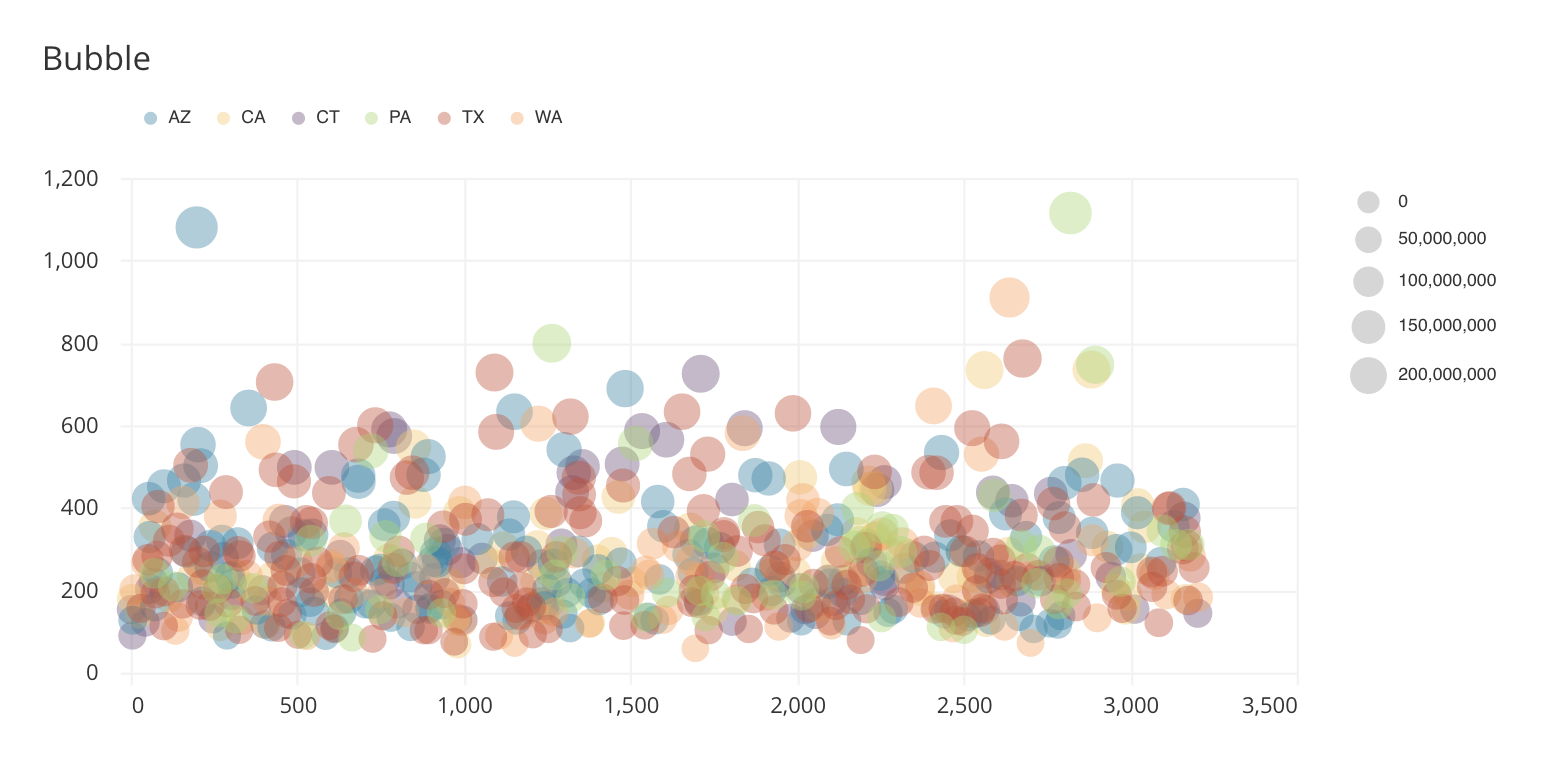 We’re just a couple months away from switching to an open-sourced community-driven visualization library called ‘Vega-Lite’. This will provide Chartio customers access to a brand new visualization library.
With Vega-Lite, our customers will enjoy a lot more customizations and settings in all chart types, improvement in chart performance, and also have the flexibility to pull custom chart types and visualizations on their own and use them in their Chartio instances.
We’re very close to launching the beta this quarter and a full launch in Q4 of 2020, so please stay tuned!
If you are interested in seeing these upcoming features in action, I highly encourage you to check our webinar. AJ does a phenomenal job with the demos which really bring the above descriptions to life.
Last but not least, we really enjoyed your participation in our event. We went through the questions submitted. Here’s the answers to some of your most frequently asked questions. If you have more, we’d love to hear them. You can contact me at kevin@chartio.com.
Frequently asked questions
Q: If you tweak the queries in SQL mode, will the changes be reflected in the Visual SQL and vice-versa? Also will you be able to switch back and forth?
A: When you create a query in Visual SQL mode, we automatically create the SQL for that query if you click into SQL mode. Changes are kept in sync until you make edits in SQL mode. We don’t currently have the ability to convert a SQL mode query into Visual mode.
Q: Does the chart query the data from the database real time? Or does it save a local copy of the data to populate the chart every time?
A: We have extensive caching settings on every dashboard. You can configure the cache duration to meet your performance needs. The minimal cache duration is 1 minute.
Q: When I make a comment on a chart – will it save the filter I set? So I can see how the user saw the chart right at the moment he commented?
A: Yes, the email notification will contain an image of the chart with the filters applied.
Q: Who receives the email notification about dashboard/chart comments? Dashboard admin or primary admin?
A: We have published our notification rules in our documentation.
Q: Can you share charts with external users who do not have a Chartio license or account?
A: Yes, you can share the charts via our Reports feature.
Q: Does Chartio have a community forum?
A: Yes, please join our Chartio Slack community! It’s a great platform to discuss any Chartio or data related ideas with our team and customers.


