What if you could place all the data, visualizations, and insights a business intelligence (BI) platform can provide wherever you want? You could bring the full benefits of BI to your employees for quicker, data-informed decisions without interrupting their workflow. Or, you could add it as a premium feature so your customers can better leverage and understand the impact of your product. In short, it would be BI on a silver platter.
That’s embedded analytics, and it gives your data the chance to venture out of the platforms and databases it normally lives within and prove its value in new ways. And this promise of new value has been gaining traction as of late. According to Allied Market Research, embedded analytics will become a $60.28 billion industry in the next three years.
So, what’s all the excitement about, and how is embedded analytics used? Let’s dive in.
What is embedded analytics?
Embedded analytics plugs complex data, usually in the form of reports and dashboards, into websites, applications, and software. In other words, it puts information where that information will get used.
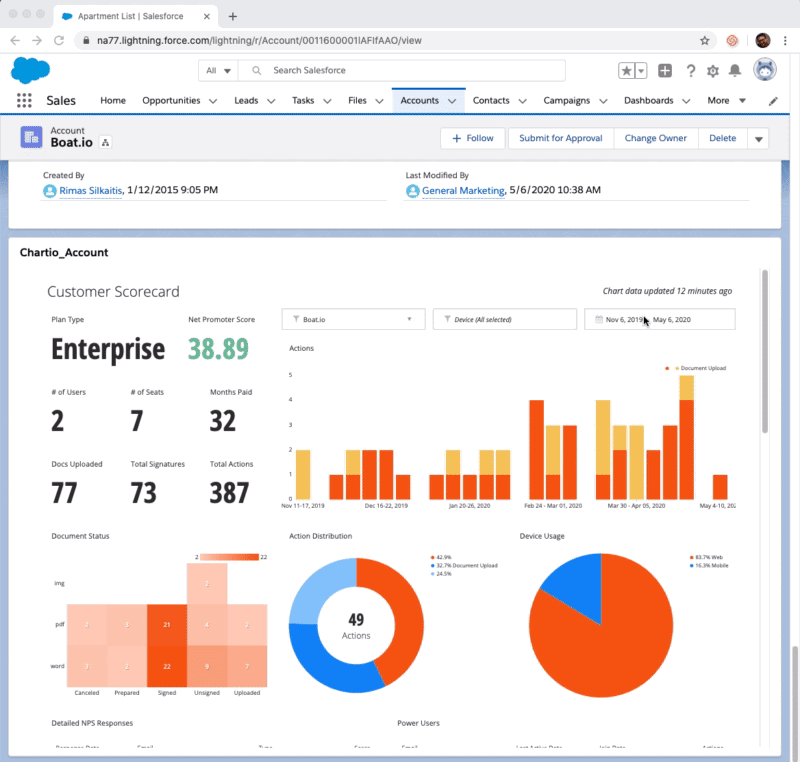
For example, if you’re writing a blog post and want to illustrate a complex concept quickly, you can embed the data right into the article:
This is embedded analytics. The dashboard is created by a hypothetical company called Dundersign Analytics and shows the status of documents for a company called Boat.io.
If you work for Boat.io and would like data on the status of your documents, this dashboard has all your answers. And you can plug this dashboard within internal tools and within your own product to provide your users with insights and access to data.
An example of an internal use case for embedding this dashboard might be that your sales team needs up-to-date information on the status of these documents in order to run more effective demos. So, you’d plug this dashboard right into the customer relationship management platform (CRM), so your salespeople don’t have to toggle between the BI platform and the CRM to swap from analysis to their work of closing deals. It’s all in one place.
An example of using embedded analytics as a product feature might be that your SaaS platform helps companies manage documents. Boat.io is your customer, and they’d like to aggregate real-time data on the status of their documents, so they can use your platform to manage them better.
The core idea here is to close the gap between business intelligence and business processes. Instead of partitioning off BI in its own platform, embedded analytics will bring BI into just about whatever location it needs to be. In particular, by integrating BI data into the workflows it impacts, you can streamline your processes and add value to your products.
What’s the relationship between embedded analytics and business intelligence?
Embedded analytics is a way of utilizing business intelligence. Instead of locking away a dashboard within a BI platform, embedded analytics is the practice of bringing that dashboard out and placing it where you need it to be.
The boiled-down definition of business intelligence is that it’s the act of using data to make better business decisions. This act is often thought of as a separate task — something you do within a dedicated BI solution. A more nuanced way of thinking about BI is that it’s an infrastructure for gathering, understanding, and visualizing business data.
Within a BI infrastructure, embedded analytics takes on the role of providing an understanding and visualization of business data. The twist is that embedded analytics provides this data outside of the confines of traditional BI systems. Getting outside of this traditional BI mindset is important because better business decisions can (and should) happen anywhere.
How is embedded analytics used?
Embedded analytics makes data more easily usable, and it can do so in three places: within your internal tools, on the web, and in your product. The purpose of embedding analytics into each of these locations can vary, but they all center on making use of data.
Internal tools
Internally, embedded analytics is used to streamline workflows. Often, specific tools, like CRMs, will have data visualization capabilities, but these visualizations don’t contain the complete picture. For instance, Salesforce can visualize sales data, but it can’t put that data in the context of larger business initiatives.
Embedded analytics, on the other hand, can pull from all of your business data and put it into Salesforce in a way that’s easy for your sales team to understand and act upon. In this way, the sales team doesn’t have to leave Salesforce to get the advanced analytics they need to inform their decision making.
Web
On the web, embedded analytics is used for creating engaging content within blog posts and on web pages. With a tool like Chartio, pretty much anywhere you can plug an HTML iframe (i.e., custom window), you can plug in your data.
This can be a useful way to communicate complex data and concepts quickly. For instance, blog posts can gain interactive charts to illustrate your arguments, and landing pages can become more than just some copy and a form.
In-product
Embedded analytics can also become a premium feature within your product, enhancing the end-user experience. LevelUp, a one-touch payment and loyalty platform for restaurants that was recently acquired by Grubhub, uses Chartio to embed analytics in order to help their users understand their data.
LevelUp’s core functionality is loyalty campaigns and payments, but with embedded analytics, LevelUp is able to add a new dimension: insights. Here’s how that looked when they first implemented embedded analytics with Chartio:
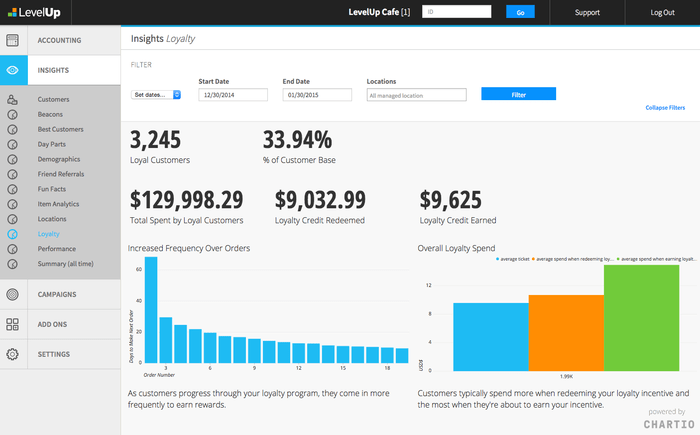
Each of their 14,000 customers now has the ability to not only manage their campaigns and payments but also measure their impact. So, if they noticed something was off, they could fix it right there in the platform without having to hop from a separate reporting tool back to LevelUp’s platform. The data analysis happens in the same place the work happens.
Three ways to employ embedded analytics
What happens behind the scenes of embedded analytics is important to know in order to make an informed decision about how you’ll utilize it. You have a few options, from leaning on your BI platform to building your own solution, and if you’re not careful, embedded analytics could become a time and money sink.
When you see embedded analytics, like the one we have above regarding Boat.io, there are three overall steps that have occurred:
- All the data has been gathered from various data sources via API and stored within a data warehouse or database.
- That data was queried and used to create a report or dashboard, which is then embedded into the website, software, or application.
- At varying intervals, depending on how the embedded analytics is built, the dashboard or report will refresh the data by running the queries again. If you see “Loading…” instead of a chart, that means the dashboard is asking the database for updated information using queries.
Of course, we’re glossing over a lot here, but it’s enough to help you make an informed choice about how you’ll implement embedded analytics. If you choose to build your own solution, you’ll need to set up your own processes to take care of these steps. Or, you can choose to invest in a set of tools designed to make the implementation process easier. You have three overall options for embedding analytics, each with its own pros and cons:
Use embedded analytics as a feature of a larger BI platform.
This option is the simplest for those already invested in a BI platform like Chartio. Most of the above steps are taken care of by the platform, so embedding analytics becomes a fairly simple, short process. LevelUp, for instance, was able to make embedded analytics available to their 14,000 users with only one developer working over the time span of a couple of weeks.
Pro: A BI platform will take care of much of the work for you.
Con: Buy-in for most BI tools can be pretty steep. Be sure to evaluate your options before making a commitment that large.
Buy a specific embedded analytics platform.
There are a few tools tailored specifically for embedded analytics. These tools aren’t full BI platforms but rather a suite of features that help developers manage the three steps above.
Pro: A specific embedded analytics platform won’t require buy-in into a larger BI product.
Con: It will only solve for embedded analytics. More complex BI capabilities won’t be possible with this tool, and it will require the work of developers to configure it. Not to mention, these tools often have proprietary languages and new user interfaces that will need some getting used to. The result is your team managing your data twice, once for your embedded analytics tool and again for everything else.
Build and maintain an embedded analytics solution using precious developer resources.
Building your own system will ensure your embedded analytics is tailored to your exact needs, right down to the look and feel. Unfortunately, this is a lot of work to maintain and can become quite expensive in the long run.
Pros: Your embedded analytics can be built exactly to your specifications.
Cons: You’ll need to dedicate significant development resources to build and maintain your embedded analytics.
What should I consider when evaluating an embedded analytics solution?
Implementing embedded analytics requires you to think through quite a few unique issues, from security to the colors you can use. Here’s a rough rundown of the most important considerations:
Developer resources: How much time do your developers have to spare to get embedded analytics up and running?
Security: How will you keep the data connection secure? If you’re not creating the embedded analytics solution yourself, look for features like an Embed Secret, which can keep your embedded analytics safe from tampering.
Interactivity: Do you want your dashboards to be interactive (like the Boat.io example) for ad hoc data analytics?
Load time: Some embedded analytics solutions will wait to load the dashboard or report until it’s done querying and visualizing every chart. If you need faster load times, consider an option that uses progressive loading that loads individual charts as they’re ready.
Personalization and theming: How much control do you need over the look and feel of the charts? Do you need a white-label solution?
This guide scratches the surface of what to consider. There are many more issues that may be unique to your business, like HIPAA compliance if you use personally identifiable information. No matter what, your embedded analytics solution should be specifically tailored to your needs. Schedule a demo today and we can help you think through your options.