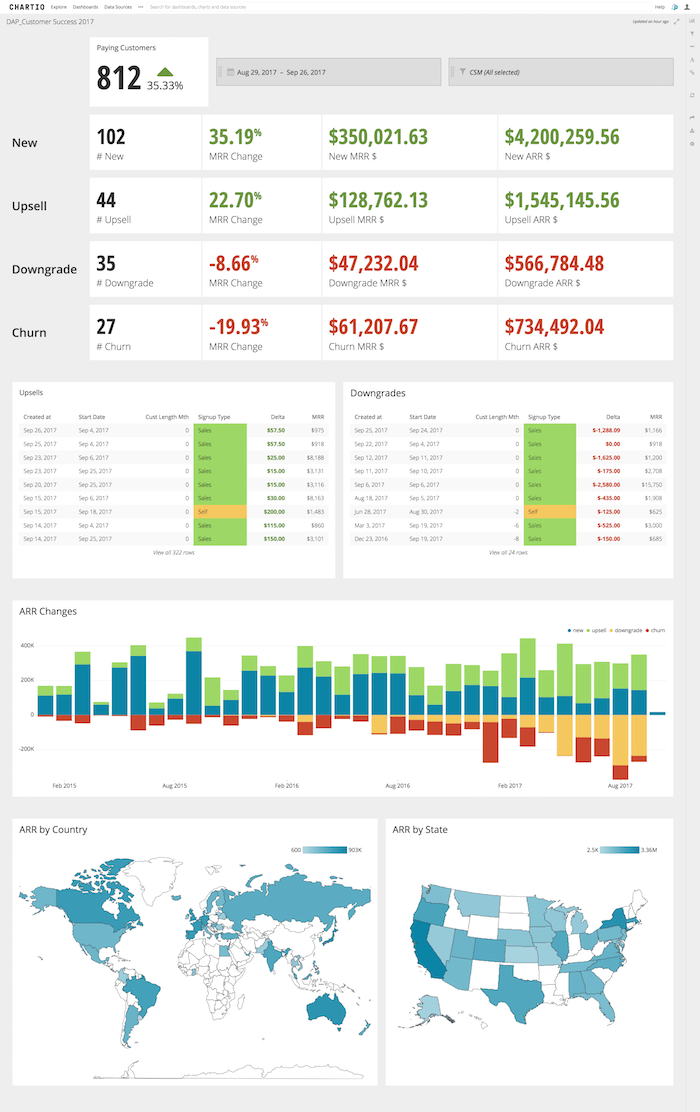
A Customer Success dashboard monitors the health of your business in direct relation to your product and its customers. Your customers are the livelihood of your business, and with that, having a view into your customer’s revenue activity is crucial to growth.
In today’s hyper-competitive world of SaaS business, doing business while maintaining a positive customer relationship has become increasingly difficult.
While your organization can hire more Customer Success Managers and optimize the customer journey, what you also need is a Customer Success dashboard that gives you revenue insights into every facet of the customer journey. This Customer Success dashboard should highlight the positives (new customer ARR, upsells) and the negatives (downgrades and churn).
In creating a Customer Success dashboard using a data analytics tool that automatically pulls and merges your data sources together (CRM data from Salesforce, customer data from Zendesk) will yield an effective dashboard.
In this article, we’ll walk you through the high-level Customer Success metrics you’ll need on your dashboard to get immediate insights.
Building a Customer Success Dashboard in Chartio
With the right metrics, data sources and data analytics tool in place, the task of creating a Customer Success dashboard can be easy.

To create a Customer Success dashboard in in the Chartio data analytics platform, follow these steps:
- Identify the metrics and KPIs you want to track in your dashboard (more on this below).
- Determine the appropriate data sources for these metrics.
- Connect your data sources, like Zendesk and Salesforce, to Chartio.
- From your organization homepage in Chartio, click the + New Dashboard button to create a new dashboard in Chartio.
- A modal will appear and direct you to name your new dashboard.
- Click the Add Chart button on the right to create your first chart.
- Use the Data Explorer to quickly start building charts without writing SQL queries and create individual charts for each metric on your dashboard.
- Continue building out your dashboard by using the appropriate chart type for each metric.
- Once you’re done, save and share your dashboard with your organization via a scheduled report or shareable link.
- Your dashboard automatically updates, so be sure to project your Customer Success dashboard on a monitor so you can take a quick glance whenever you need to.
Choosing the Right Metrics for a Customer Success Dashboard
Depending on your business, your dashboard may differ from the one we’ve shared above, and that’s perfectly fine. The most informative dashboards aren’t static ones that track the same metrics over time, rather the most insightful dashboards that the ones that grow and change alongside your business.
Again, we’re providing tips, but every dashboard you create—even a Customer Success dashboard—needs to be modeled off of your own business.
With that in mind, here are our recommendations for the metrics and charts to have on your SaaS Customer Success dashboard:
Paying Customers (Single Value Chart):
The number of current customers with an indicator arrow showing whether that number is trending up or down (as a growth measurement).
New Customers (Single Value Charts):
A drill down of the your new customers by the following metrics:
- # New Customers
- Monthly Recurring Revenue (MRR) Change
- New MRR $
- New Annual Recurring Revenue (ARR) $
Upsell Deals (Single Value Charts):
Unlike net new customers, upsell metrics are based on existing customers expanding their subscriptions, and therefore growth in revenue.
- # Upsells
- MRR Change
- Upsell MRR $
- Upsell ARR $
Downgrade Accounts (Single Value Charts):
Downgrade, or gross dollar churn is the percentage of total revenue lost as a result to a customer downgrading their subscription of your product or switching to a lower priced tier.
- # Downgrades
- MRR Change
- Downgrade MRR $
- Downgrade ARR $
Churn Accounts (Single Value Charts):
Churn is a traditional metric for Customer Success teams and measure the percentage (or dollar amount) of customers that leave your product.
- # Churned Customers
- MRR Change
- Churn MRR $
- Churn ARR $
Upsells (Table Chart):
A granular version of each upsell customer and dollar amount.
Downgrades (Table Chart):
A granular table chart with data around each downgrade and the loss in dollar amount per account.
ARR Changes (Bar Chart):
A visual snapshot of all ARR changes (new revenue, upsell, downgrade and churn) at a glance.
ARR by Country (Map):
A visual representation of ARR by country and provides a geographical understanding of your customer base.
ARR by US State (Map):
A visual representation of ARR by state. This can be useful for measuring where your customers are and dividing up account portfolios amongst your Customer Success Managers.
Conclusion
As Customer Success provides a significant part of every organization’s overall business and growth, it’s equally wise to measure their activity via a dashboard. When organizations optimize for Customer Success, especially through a dashboard, they’re more than likely optimizing for growth. If you would like to try building your own Social Media dashboard, you may start a free trial with Chartio.