Chartio Best Practice: How to Optimize Dashboard Performance
Posted by on January 4, 2019 Chartio, Best Practice
We hate it when our customers are facing slow loading dashboards. This can happen from a variety of reasons, but regardless, no one likes to wait for their charts to load or see errors on their dashboards. This post will walk through some best practices in Chartio that will help you make sure you’re set up for great performance.
1. Increase Dashboard Cache Duration
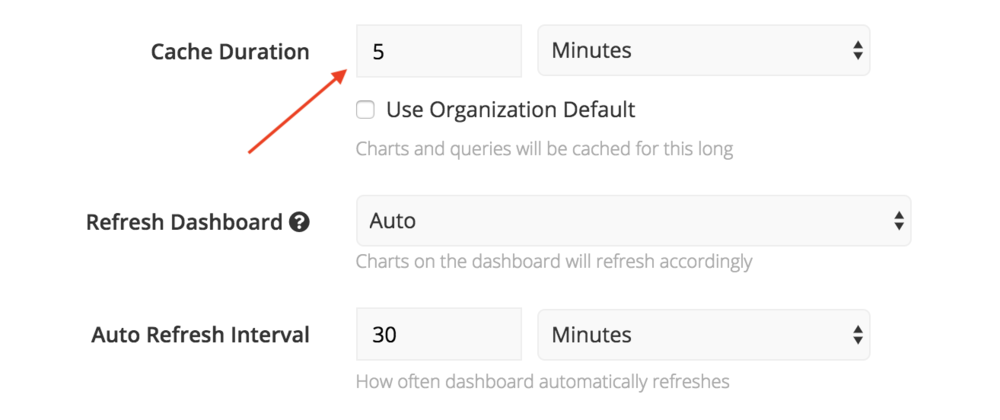
The dashboard setting for cache duration determines how long the data on the dashboard is considered “fresh”. For example, if the cache duration is set to five minutes, when a user opens the dashboard or refreshes the page then new queries will be sent to your data source if the data is more than five minutes old.
If you have dashboards that don’t need updated data every few minutes or every hour, you should increase their cache duration to minimize the number of new queries. The cache may be overridden by manually refreshing an individual chart or dashboard.
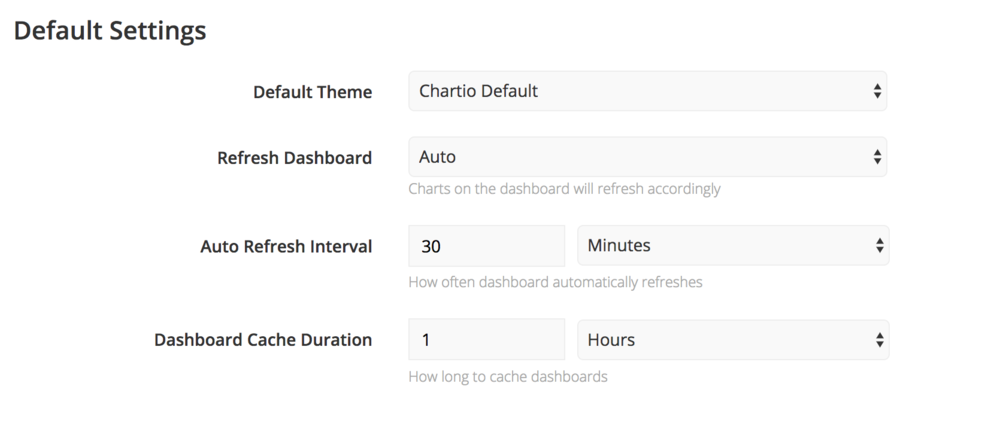
The default dashboard cache duration may be changed from your organization settings. For bulk updates to your dashboard refresh method or cache duration settings, submit a Support Request and our team will assist.
2. Keep Shorter Dashboards
Each dataset in each chart is an individual query, and when you multiply that by the number of charts on your dashboard, it may result in a large number of queries sending to your database at once. This has the potential to overload your database, and when you take the database and Chartio concurrency limit into account, there are going to be queries waiting before they have a chance to run.
Our CEO previously wrote a great article on this topic. He also gives advice on how to navigate shorter dashboards by linking dashboards to each other and using categories.
We also have a terrific guide with How to Design a Dashboard book on our Data School.
3. Identify the Charts with Frequent Errors or Slowest Charts
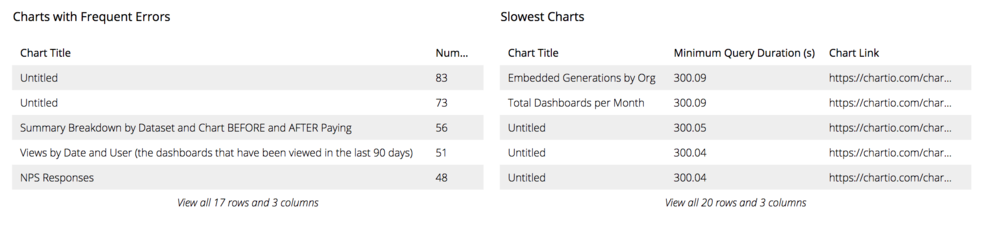
You can view query and performance data under the “Stats” tab for every data source connected to Chartio. From there you will see the charts with frequent errors and the slowest charts querying that data source.
For charts with frequent errors, you should look at the query log to identify the errors. It’s possible the errors are from badly written queries or from the query timeouts. With the slowest charts, see if the queries can be rewritten to be optimized. Alternatively, you may want to create a data store in Chartio or a materialized view in your database to pre-aggregate the data.
4. Use Data Stores for Common and Expensive Queries
Data stores schedule queries to run and save the results as a new data source on Chartio servers. You can then point your charts to query the data store itself. As a result, if you use the same data across multiple charts, by using a data store table the database query will only need to run once instead of multiple times.
Another advantage of data stores is they help relieve your database of long-running queries that may be tying up resources. In practice, any query taking longer than the max query duration of five minutes should be turned into a data store table which has a max query duration of 30 minutes.
5. Stagger Scheduled Jobs
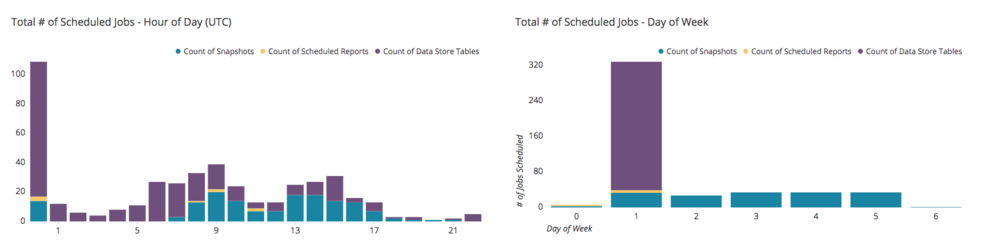
Any scheduled query or load you have in Chartio such as a scheduled report, alert, data store, or snapshot will trigger new queries to your data source. If you have, for example, many reports running at the same time every day this may cause a spike in query duration due to the number of queries concurrently running against your database.
A best practice for optimal performance is to stagger your reports, alerts, data stores, and snapshots to run throughout the day or outside of business hours. If you reach out to our Support team we’ll be happy to provide insight into your organization’s scheduled jobs and help you reschedule them in bulk.
6. Uncheck the “Auto Apply Variables” Dashboard Setting
By default on a dashboard, whenever you change a selection in a variable such as a calendar or dropdown it will automatically send new queries to update your charts. This may cause extra queries to send to your data source if, for instance, you need to select a couple values in a dropdown and also adjust the date range in your date slider.
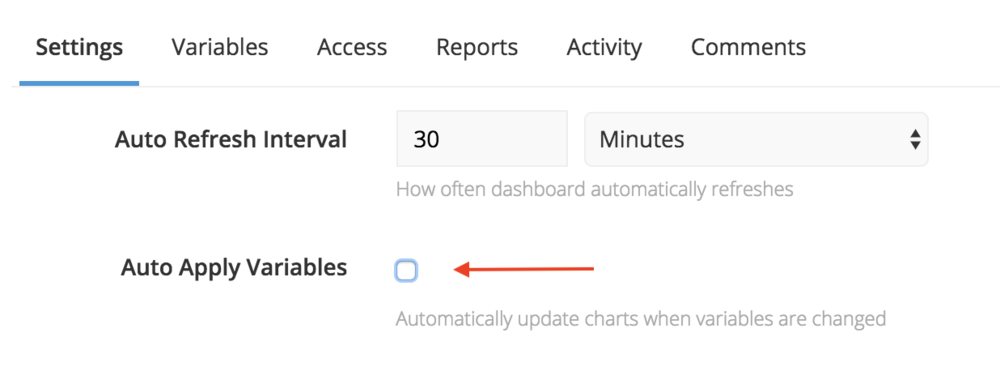
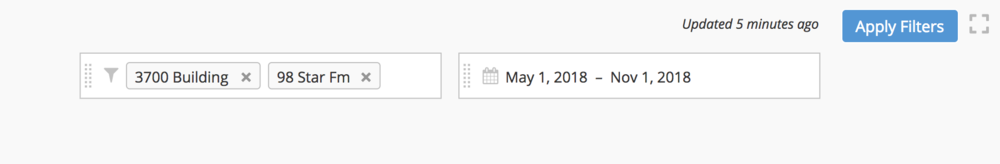
Unchecking the “Auto Apply Variables” checkbox in your dashboard settings allows multiple variables to be updated and the changes to be applied all at once. When it is unchecked, the filter selections won’t be applied to your charts until you click the “Apply Filters” button on the top right.
7. Limit the Number of Concurrent Queries
Your database (such as Redshift, PostgreSQL, and MySQL) may have a concurrency limit that determines the number of queries that can run at any point in time. If there are 50 queries fired from a dashboard but only 10 available slots, then 40 queries will be waiting in the queue before a slot opens and they can begin running.
There is a rate limiter on Chartio’s side per data source as well that defaults at 100 for most sources. If we adjust the Chartio rate limit to the same limit as defined in your database, this will reduce wait time and provide optimal performance. Contact our Support team and we’ll be happy to adjust the Chartio rate limit setting for you.
For more help or for personal consultation with a member of our Customer Success team, feel free to reach out to support@chartio.com or sign up for a training here.


