If you use MySQL, you’re in good company. As the second most popular database in the world, it forms the foundation for much of the modern technological landscape. Its wide usage and massive impact have given rise to an entire ecosystem of MySQL reporting tools that aim to help you get the most out it.
But deciding which one is right for you can be a daunting task. So, we thought we’d kick-start your search with a few things to consider and a run-down of some of your best options.
What to consider when vetting MySQL tools
There are many MySQL reporting tools available, each one filling a specific niche. To hone in on which tools are most suited for your needs, we’re going to consider three overarching criteria:
1. Reports, dashboards, or charts?
The MySQL reporting tools available in today’s market range from enterprise-level business intelligence (BI) tools to free, web-based graph and chart creators. This wide array of solutions means that you have to first decide what you’re looking to create and whether you need a specialized tool or a Swiss Army knife that can do it all.
One common misconception is that reports and dashboards are the same thing. In fact, they are different, but related ways of reporting on data. Whichever you choose to create will narrow down your list of MySQL reporting tools.
A report is in-depth, comprehensive, and usually static. Its goal is to provide a lot of information so you can do a really deep dive. On the other hand, a dashboard is a dynamic, real-time snapshot with a relatively narrow focus. Its goal is to provide vital information at a glance so you can make data-informed decisions quickly. When it comes to MySQL reporting, a tool may focus solely on one or provide the ability to create both.
Outside of dashboards and reports, you may just need the ability to make a quick, one-off graph or chart. The tools that enable you to create a report or dashboard can also help with this, but investing in them may be like trying to hammer a nail with a sledgehammer. There are some free, open-source tools that can help you make a chart or graph here and there.
2. What do you have in place?
Because you have so many options, you need to understand how the reporting tools you’re considering fit within your existing technology and processes. We recommend taking four things into account:
- Your team. Think about where the team is now and where they’ll be in a year or so. Keep this in mind whether you’re choosing a one-off solution or a platform that can scale as you build the team.
- Time. Often, a tool that’s light on the budget may turn out to be quite the time sink. If you need an immediate, free solution, make sure it’s also easy to use. Otherwise, it can take much longer than a paid tool.
- Technical know-how. Some tools are out-of-the box but limited in their features and capabilities. Others are very robust, but hard to use for those who can’t code. Think about who the end users are going to be and if they can handle a complex and technical tool.
- Budget. Your options for MySQL reporting tools range from completely free small tools to expensive enterprise software.
3. What are you using it for and where will it live?
The type of data you use, how you intend to use that data, and where your reports will ultimately live are also important aspects to keep in mind.
The most important point is that not all these tools are secure—in particular, the free, open-source web apps. If you use sensitive data, such as data thatrequires HIPAA complianceor enterprise resource planning (ERP) data, steer clear of insecure tools.
If you’re looking to democratize your data by making it available to all employees, look for more user-friendly tools. For instance, Reddit uses both MySQL and Chartio, which allows non-technical teams like sales to access their data and create reports.
Finally, some tools specialize in different reporting formats, so consider what each is best at creating. The range can be anywhere from a PDF, an embeddable dashboard, or automated alerts.
Without further ado, let’s dive into a few of your options.
Quick-and-dirty MySQL reporting tools
If you’re looking for a quick, immediate solution, there are several tools you can use. You might already be familiar with some of these. Although these aren’t tools you can build a team around, they can be great in a pinch.
Microsoft Excel
Yes, you can use Microsoft Excel to create reports with MySQL. It’s best for quick charts and graphs. It can create reports but the process is time-intensive and not very fun. Also, it isn’t good for dashboards because it’s not well suited for real-time data.
This is a decent option for small teams that already use the Microsoft Office suite, but don’t want or need to invest in Power BI. Excel doesn’t require much technical know-how to do some visualizations, but you may need to use Visual Basic to create more complex graphs and charts.
That said, Excel visualizations are versatile, and you can use them in many places like presentations, Microsoft Office documents, and much more.
Learn more
Google Data Studio
Google Data Studio is a free data visualization tool from Google that can hook up to MySQL directly. It’s also good for quick charts and graphs, and it can be a little faster at creating in-depth reports than Excel. You probably won’t want to use it to create dashboards, because real-time datahas to go through some extra steps to populate.
Small teams and individuals who use the Google Suite may really enjoy Google Data Studio, as it’s fairly intuitive and completely free. Like Excel, Google Data Studio visualizations are also versatile but are best suited for use with other Google products.
Learn more
SQLpad

SQLPad is a free web app for running and visualizing the results of SQL queries. Its use case is for quick data exploration and individual charts and graphs and explicitly states that it’s not a dashboarding tool and never intends to be one.
Individuals with technical know-how who want to explore their data quickly will like SQLPad. Because it’s self-hosted, it will require some setup. But if you know what you’re doing, it can be a fairly low-lift tool to use.
Learn more
- How to get started with SQLPad
- More about SQLPad
Other tools to consider
- LibreOffice Charts using their MySQL Native Connector
- Kloud.io if you want to query and visualize your data within your spreadsheet application
- Ubiq for small-scale, quick reports and graphs
Enterprise MySQL reporting tools
If you’re looking for a MySQL reporting tool that your company can rely on and grow alongside, you’ll need to invest time and resources into some larger tools. These tools will take time to vet and try out before committing.
Power BI

Power BI is Microsoft’s enterprise-level business intelligence tool that’s well-suited for reports and dashboards. Using it just for one-off charts and graphs may not be the best use of its suite of features.
Integrating Power BI with MySQL is possible, but because it’s part of the Microsoft ecosystem, it connects more easily to Microsoft SQL Server. Large, Microsoft-based departments looking for a foundational tool to build their teams around will like Power BI.
Learn more
Tableau
Tableau is one of the most well-known legacy BI tools that can integrate with MySQL. It’s best for dashboarding and deep reports. Similar to Power BI, Tableau is a large, unwieldy tool that isn’t well-suited for teams looking only to make quick charts and graphs.
Mid-size to large teams on a trajectory for growth may find Tableau to their liking, thanks to its powerful visualization technology. That said, its user-friendly veneer has been tarnished by its reputation as being very hard for non-technical people to pick up.
Learn more
Metabase
Metabase is a free, open-source business intelligence tool that’s great for dashboarding and reports. The free version still takes a significant time investment, so it’s not the best tool for quick charts and graphs, either.
Technically savvy teams that often work with non-technical employees may like Metabase because its querying system is based on natural language. But to get the most out of it, you need to know your stuff when it comes to SQL.
Metabase is free, but because it’s open-source, you have to rely on its community for tech support, which can make it a tough choice to invest in long term if you’re planning to build your team around it. Otherwise, you could shell out for the Enterprise Edition or paid support.
Learn more
- How to connect Metabase with MySQL and other databases
- How Metabase visualizes SQL data
- More about Metabase
Other tools to consider
- JasperSoft reports if you know and rely on Java and also need a large volume of reports
- Any of the 10 BI tools listed here
Goldilocks MySQL reporting tools
Then there are the “Goldilocks” MySQL reporting tools that can serve a variety of needs fairly easily without too many limitations one way or the other. These tools are quick to spin up, have a robust feature set, and won’t break the bank.
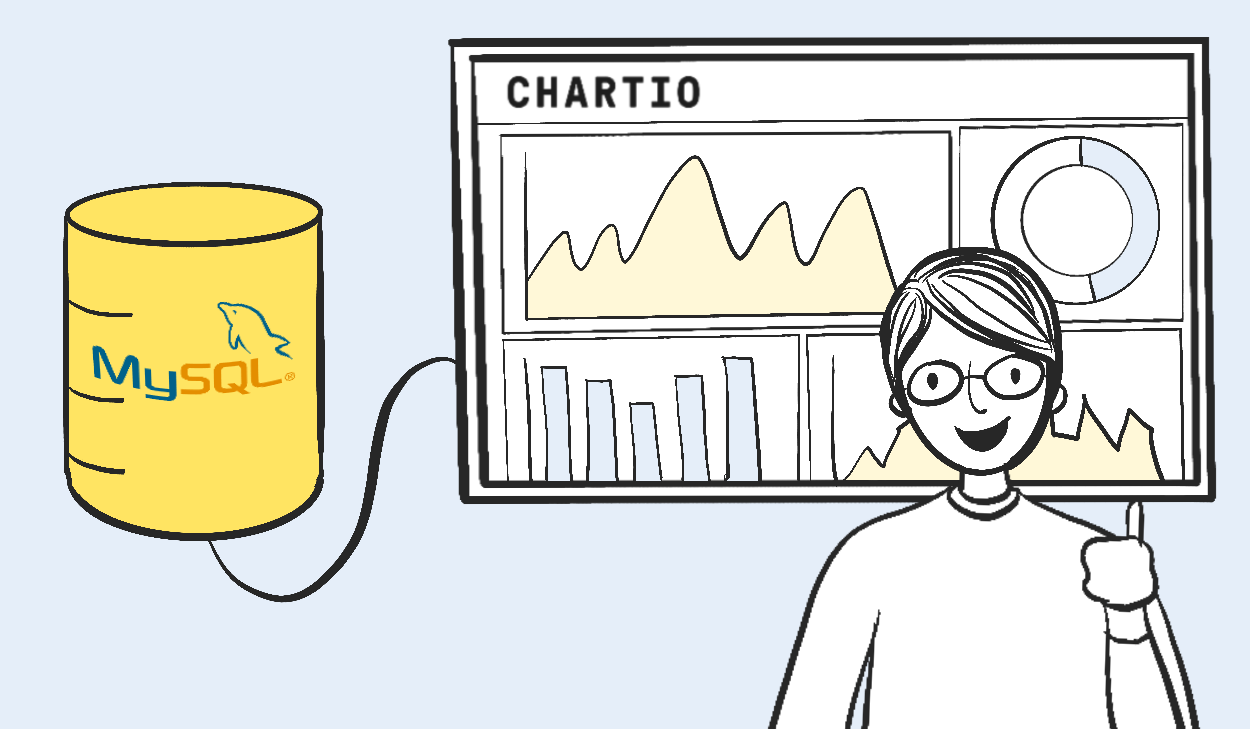
Chartio

If you’ll forgive us for being a bit boastful, we believe Chartio sits within this “Goldilocks” zone when it comes to MySQL reporting tools. It’s great for reports, dashboards, and charts and graphs, it’s easy to use, and it can suit the needs of just about any size of business.
It’s a simple process to connect Chartio to MySQL:
And once connected, VisualSQL makes it easy for both technical and non-technical users to quickly query and visualize MySQL data. This ease of use makesdemocratized data an inevitability, allowing you to scale as you need. We’re also secure and HIPAA compliant.
When you’re ready, you can share your dashboard or report in a number of ways, from embedding to PDF exports to email to Slack alerts to collaboration right within Chartio itself.
Learn more
Other tools to consider
Getting started with MySQL reports
There’s a lot to consider when choosing a MySQL reporting tool, from the size of your team to your technical ability to your end ultimate end goal. Fortunately, you have the option to try most of them for free. So, don’t be afraid to roll up your sleeves and give it a go. MySQL is a powerful database—you should choose a reporting tool to match.
You can start today for free with Chartio and have a MySQL report or real-time dashboard in no time.