
SQL is a powerful programming language that allows you to talk to databases and fetch data. But its real power is unlocked when you use that data to create dynamic, real-time dashboards that provide a snapshot into the health of your business. And SQL dashboard tools are what make this all possible.
The job of SQL is so important that much of modern business intelligence (BI), a $22.8 billion industry, revolves around how to use it effectively. The technology behind SQL dashboard tools is specifically designed to fully leverage the power of SQL and make your data work for you.
If you’re in the market for an SQL dashboard tool, you need to understand why it’s important and what to look for. If you choose well, you’ll be investing in a technology with the potential to transform your business forever.
What Are SQL Dashboard Tools?
An SQL dashboard tool is a standalone BI tool (or function within a larger BI platform) that takes you through the workflow of querying, exploring, and visualizing data. The dashboard is the end result, hosting dynamic, interactive charts and graphs that help you understand and communicate trends and insights.
Because of SQL’s role in BI, one of the core functions of BI platforms is helping users leverage SQL to query, explore, and visualize data. So, even though SQL dashboard tools can be standalone tools, when people refer to them, they may be referring to one function of larger BI platforms.
In either case, the SQL dashboard tool needs to help its users accomplish three things: query, explore, and visualize data.
To enable you to query data, the SQL dashboard tool connects to one or multiple data sources. It then provides a space to code SQL which allows you to talk to the database and fetch data.
To effectively query data, you need context around how the data is organized and the ability to explore freely. Many SQL dashboard tools will include the ability to browse the schema (i.e., how you organize and refer to your data within a database) and to manipulate queries on the fly and navigate through results before visualizing them.
Then comes the fun part. You can visualize the results of these queries as dynamic charts, graphs, and numbers within a dashboard. There are usually tons of options for dashboard theming and customization, so you can have a field day once you’ve got the data you need.
What Should an SQL Dashboard Tool Do?
Before you evaluate your options, there are a few things you should look for in an SQL dashboard tool to determine if it’s the right fit. Overall, it needs to connect to many data sources, allow you to explore data, help you write better SQL, and create great dashboards.
Easily Connect to many data Sources
To fetch and query data, it all to be accessible within the SQL dashboard tool. This requires a robust library of data source integrations, which will provide flexibility and allow you to get to work faster.
Ideally, you should look for more integrations than you currently need. Down the road, you may outgrow your current data storage system and need to switch things around. If your SQL dashboard tool can accommodate that new system, the process will go much smoother.
In addition to multiple data sources, you should take a look at the process for connecting a new source. The simpler the SQL dashboard tool makes it, the faster you can get to the real work of querying, exploring, and dashboarding that data.
Allow you to Effortlessly Explore Your Data
To run a query, you need to refer to the specific names of tables, columns, schemas, and more. A good SQL dashboard tool will allow you to browse and organize your data visually to easily reference and customize these names as you make queries.
There are two ways an SQL dashboard tool should help with this:
- The ability to customize your schema This will help you see how to refer to your data correctly, as well as change names, group sets of data together, and much more.
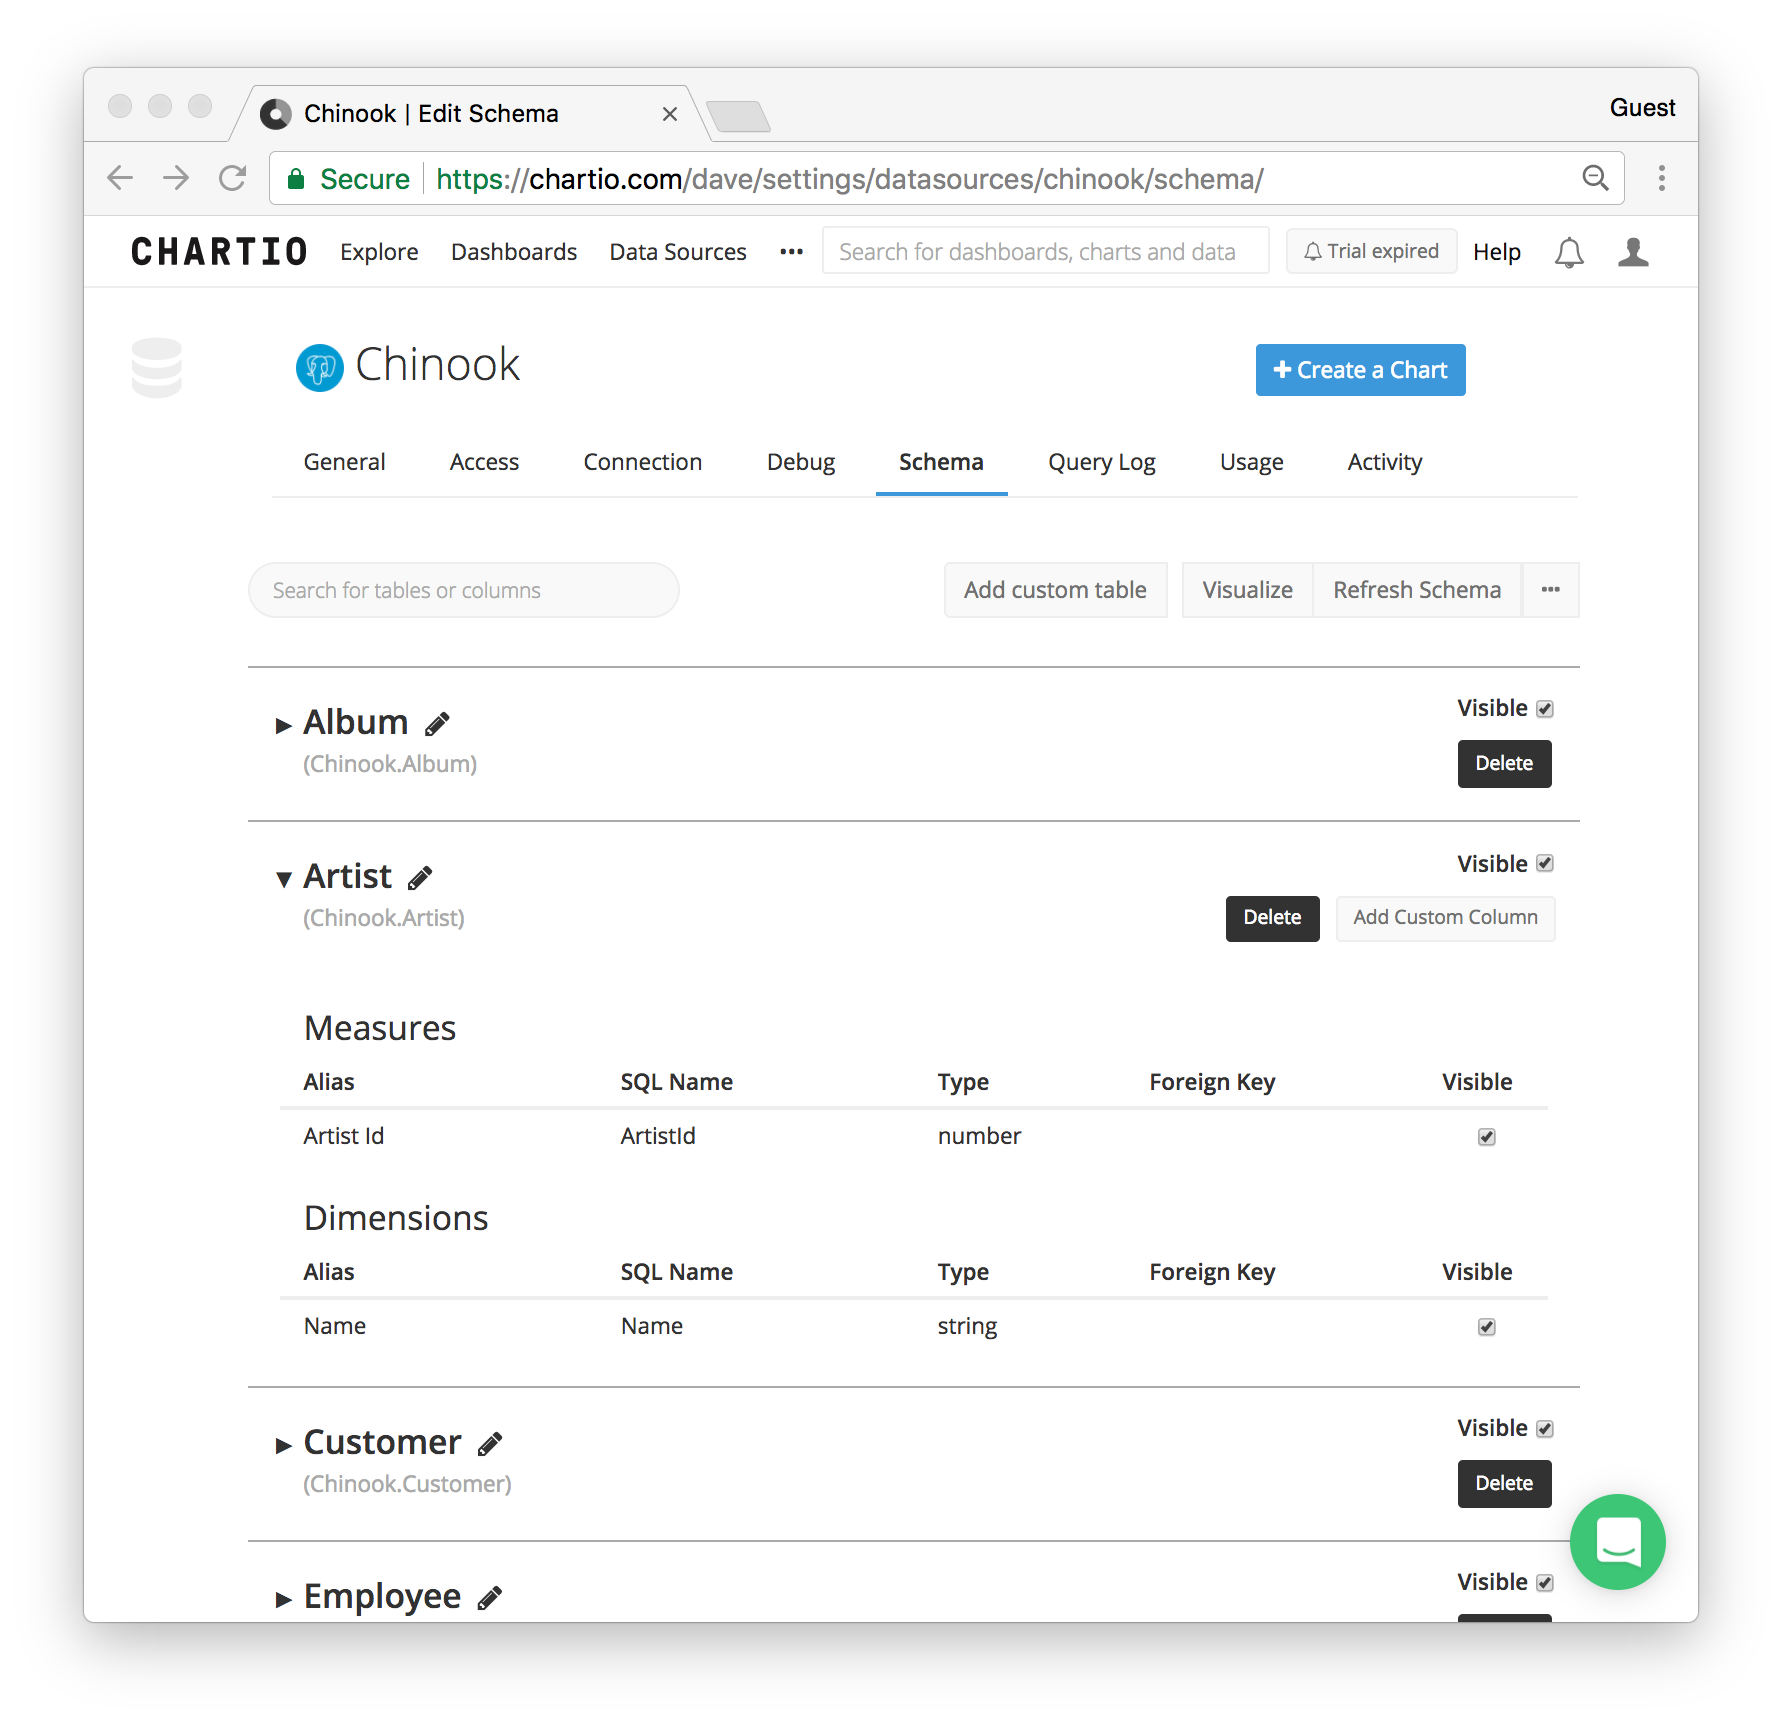 Source: https://dataschool.com/learn-sql/schema-browsing/#visual-schema-browsing
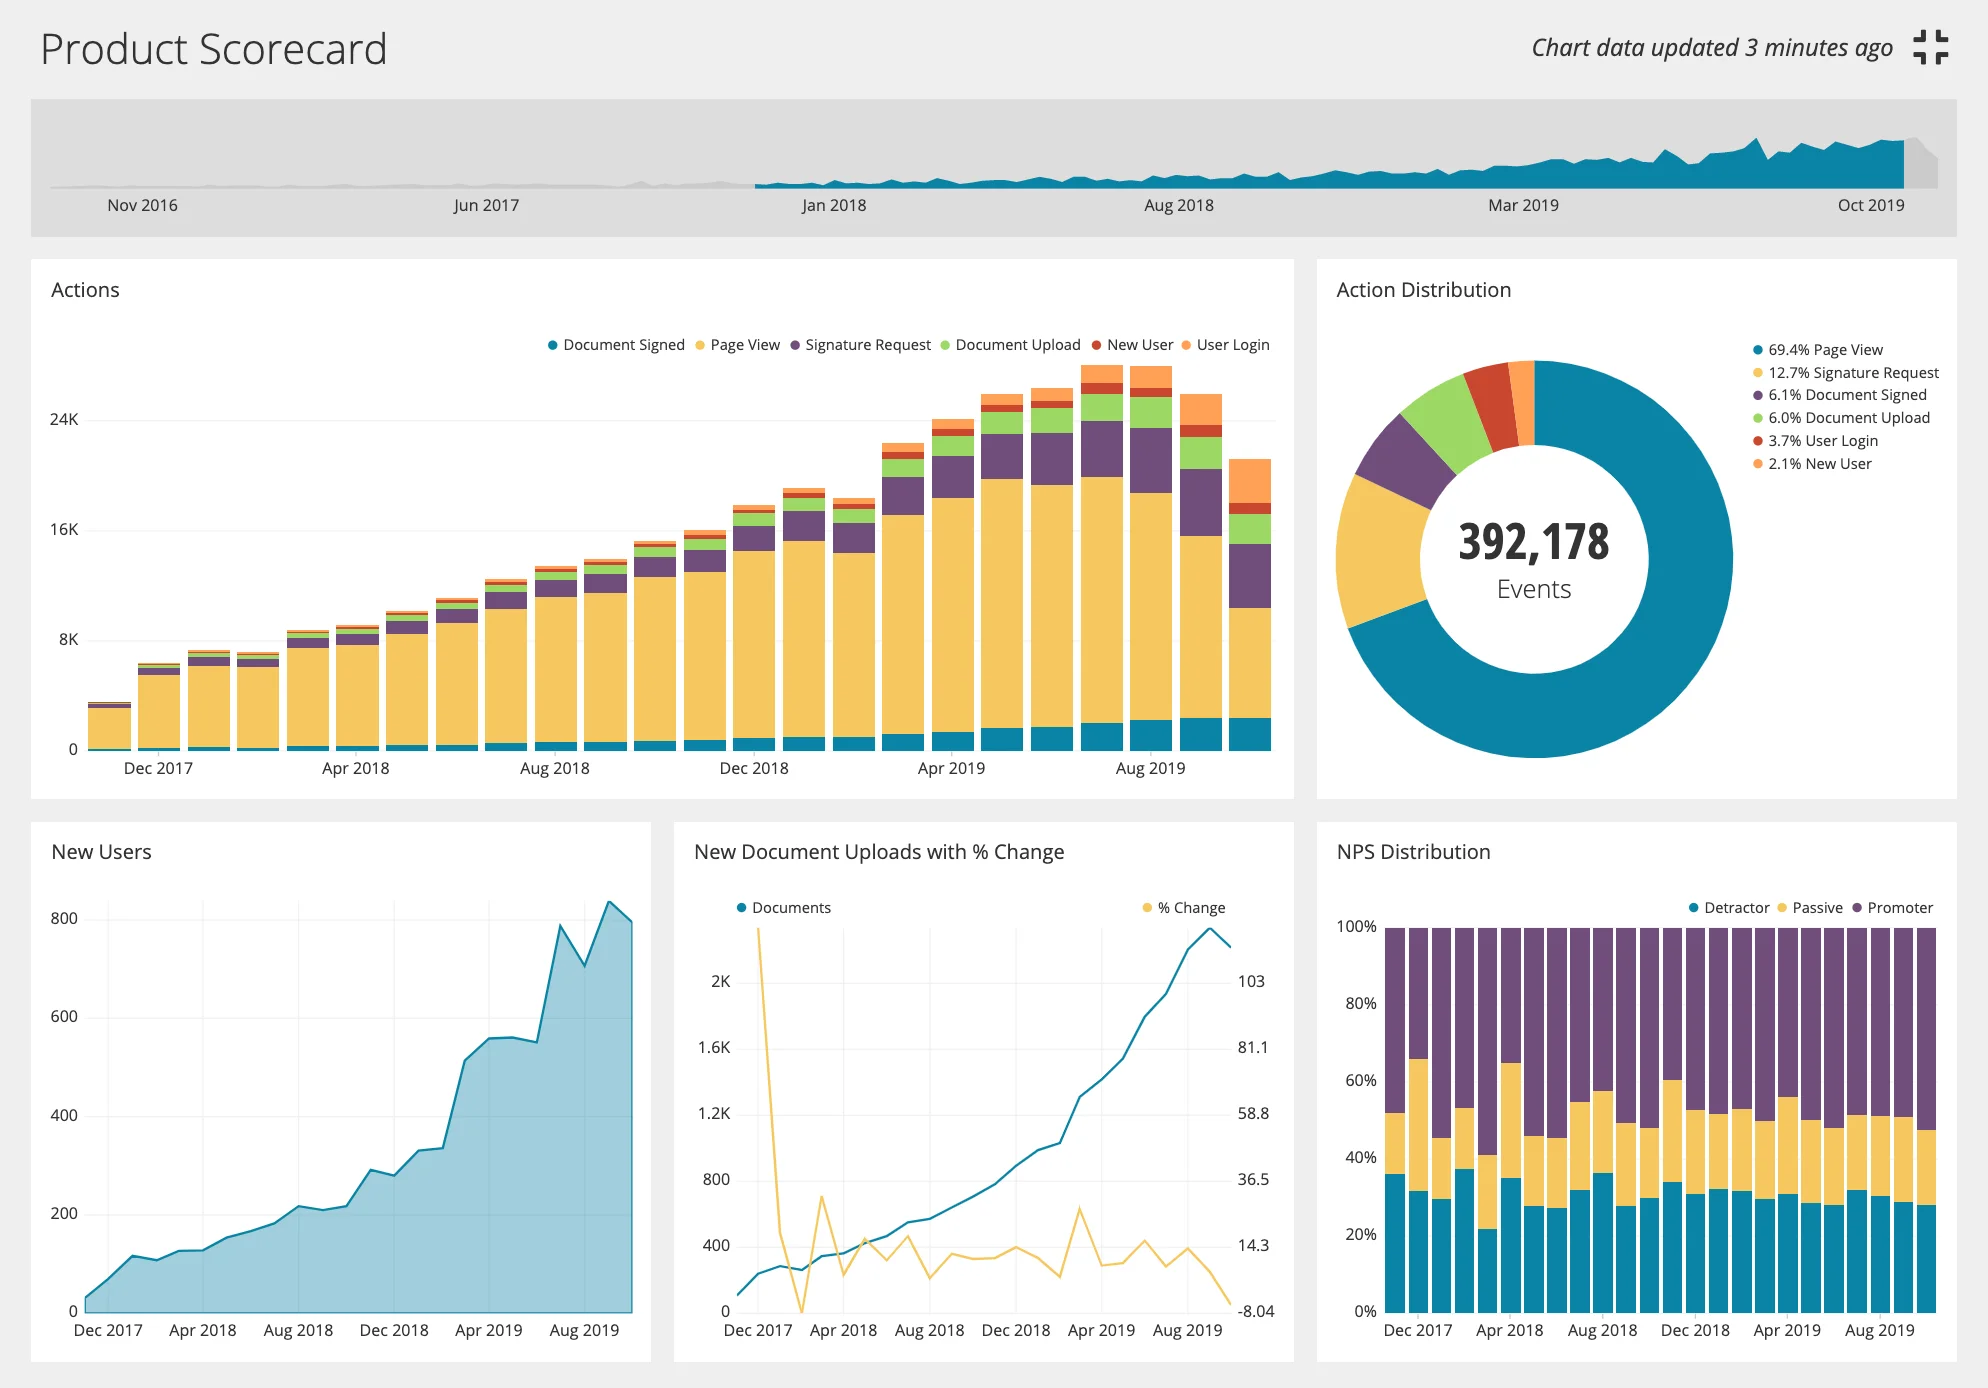
- The ability to **explore data freely** You’ll want the freedom to run queries and explore results that you don’t necessarily want to include in your dashboards yet. This will allow you to run experiments and explore your data without affecting your database or dashboard. And it’s a great way to become familiar with your data and how it’s structured. Here’s how it looks in Chartio:
Have a strong SQL Editor
Whether just exploring data or creating an important executive dashboard, an SQL dashboard tool should make using SQL a breeze. Each business intelligence tool has a unique way of facilitating the use of SQL, but there are some features to always keep an eye out for:
- SQL version control This will help your team manage changes in your SQL code and restore older versions if needed.
-
Autocomplete and automatic formatting SQL syntax is notorious for being kind of annoying to code. In fact, through the study of our historic usage data,we found that we could “correctly predict a user’s desired grouping or aggregation 88% of the time.” This means making queries can be a repetitive, tedious task. An SQL editor with autocomplete and automatic formatting will take care of this grunt work and speed everything up.
Source: https://chartio.com/product/visual-sql/
- Complete control over SQL Some business intelligence tools have a proprietary way of managing SQL. In some cases, it’s executed well. But in many others, that unique process can actually put a layer between you and the code. This will make it harder to get the code to do exactly what you want. So, look for tools that have features that speed up SQL without making the code itself harder to use.
Make SQL easy for non-technical people
The true benefits of an SQL dashboard tool are only fulfilled if everyone across the organization can query and visualize data.
When data team members are the only people capable of creating dashboards, there will be a huge bottleneck in the flow of knowledge. Reddit found this out when they tried to put data in the hands of their sellers. It was simply too much work for their data team to handle.
A good SQL dashboard tool will help non-technical people, like the sales team, query data on their own without interrupting the work of others. The result for Reddit was a spike in sales that was only possible because the power of SQL was given to people who couldn’t code SQL.
This is one of the primary motivations behindVisual SQL, Chartio’s proprietary technology that sits atop SQL to make it easier for everyone to query, visualize, and act on their data. Here it is in action:
Create Dynamic, Customizable Dashboards
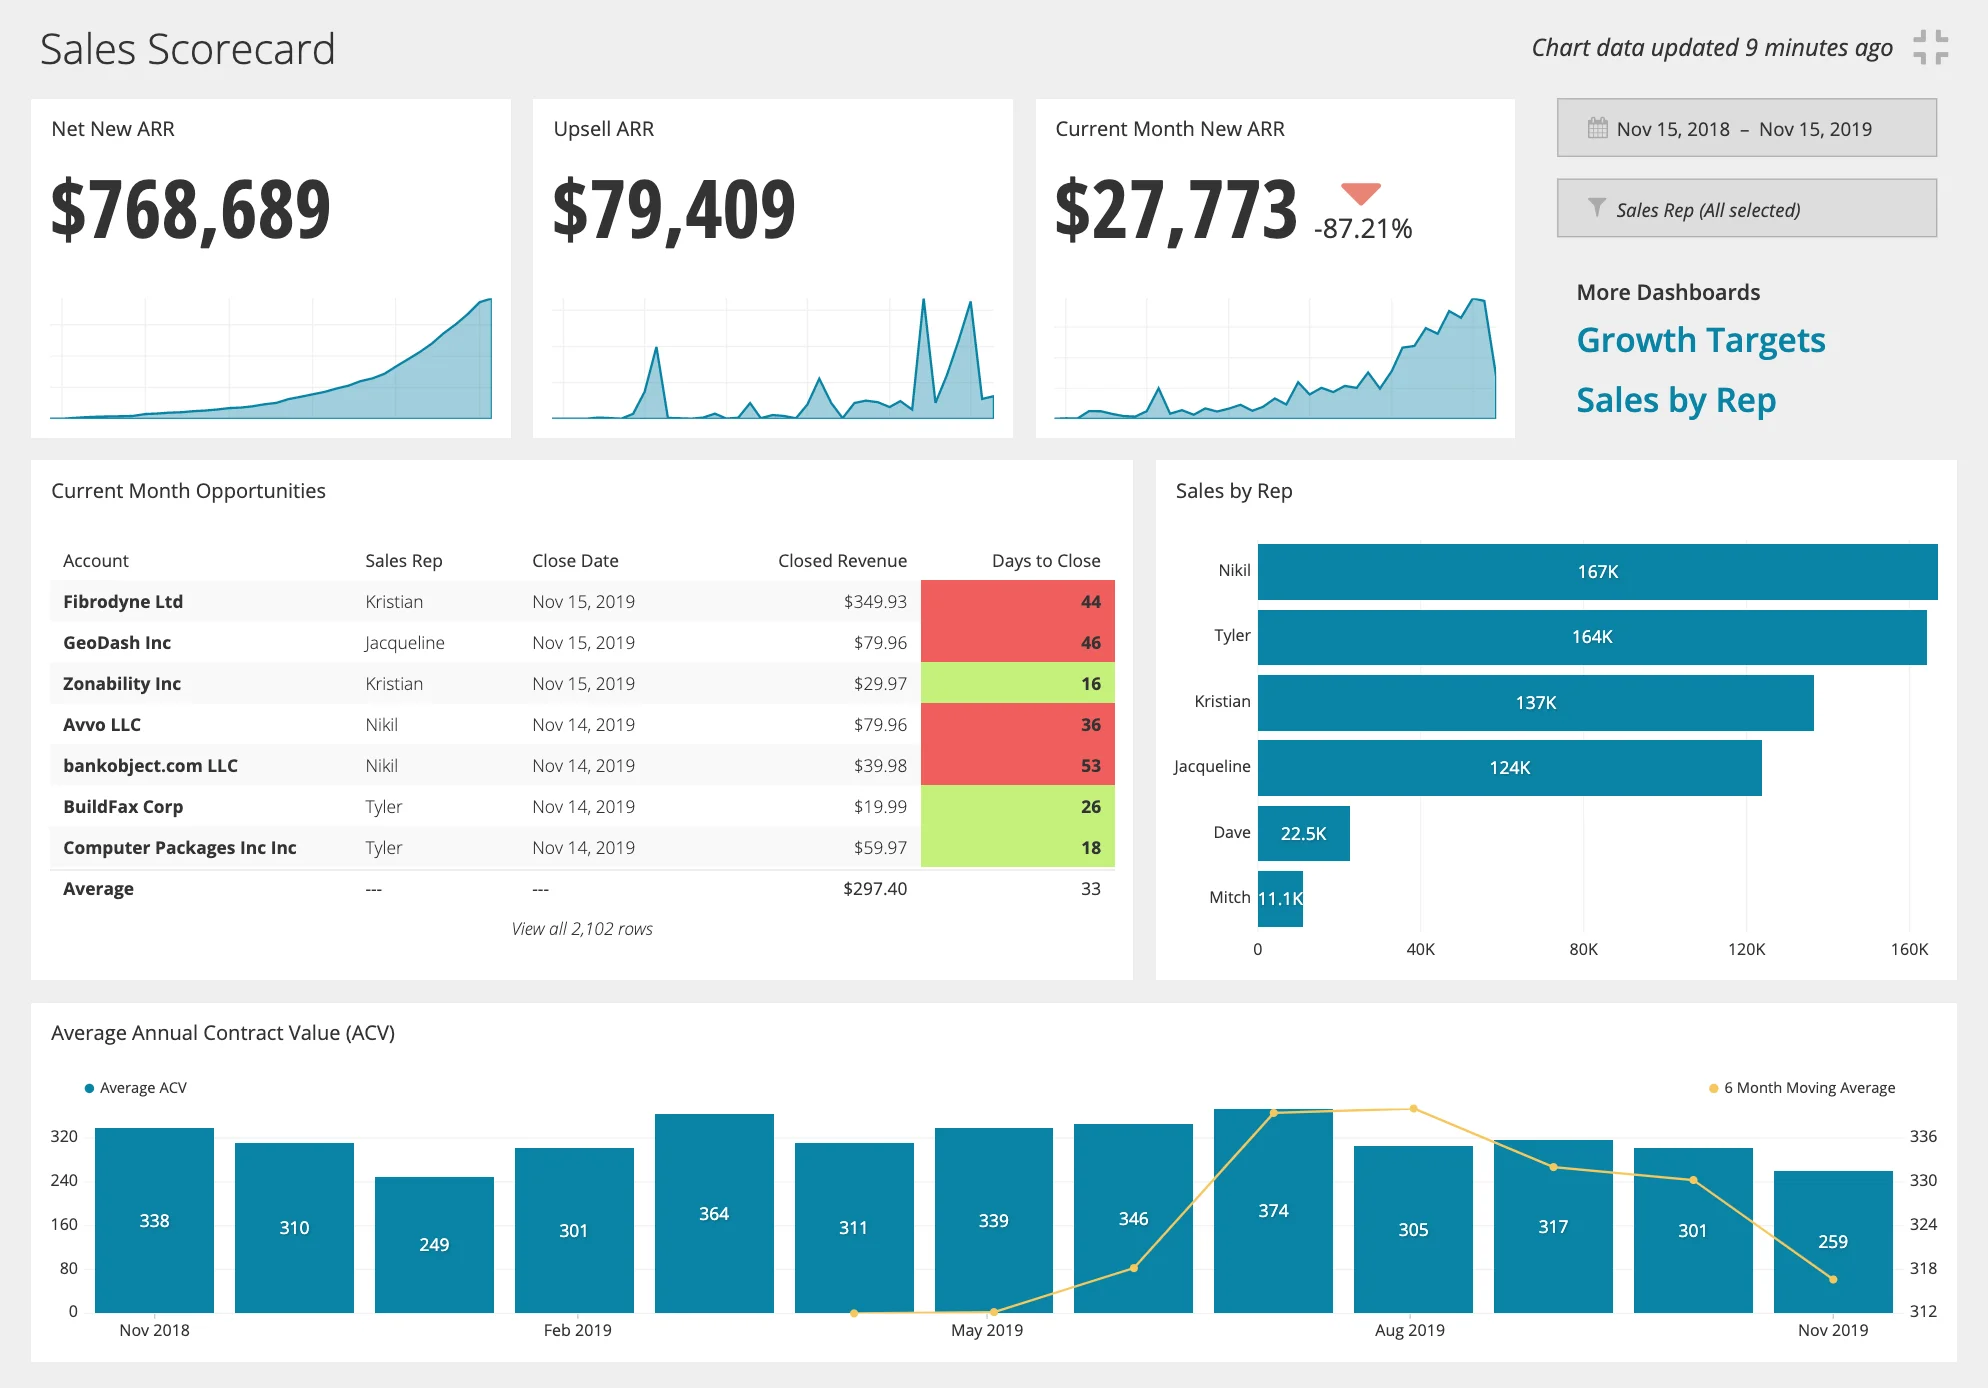
The fun part of this whole process is creating beautiful dashboards you can’t wait to share with the rest of the team. An SQL dashboard tool should create dynamic and interactive charts from your queries that are easy to drag, drop, and customize.
By dynamic and interactive, we mean that your charts and visualizations react to changes made to your queries and any adjustments you make to the variables.
From there, a suite of cosmetic options will allow you to change colors, create custom themes, and truly make your dashboards your own. Once they’re done, you should be able to use these dashboards however you need, whether that’s embedding, exporting as a CSV, or collaborating within the dashboard itself.
Which SQL Dashboard Tool Is Right for Me?
Ultimately, which SQL dashboard tool you choose will depend on the size of your company and the technical ability of your team. We did a full breakdown of 11 different data visualization tools for SQL that can help you make a choice.
If you want to get started right now with an SQL dashboard tool that ticks all the boxes, you can start a free Chartio trial today.