Data Source Query Log
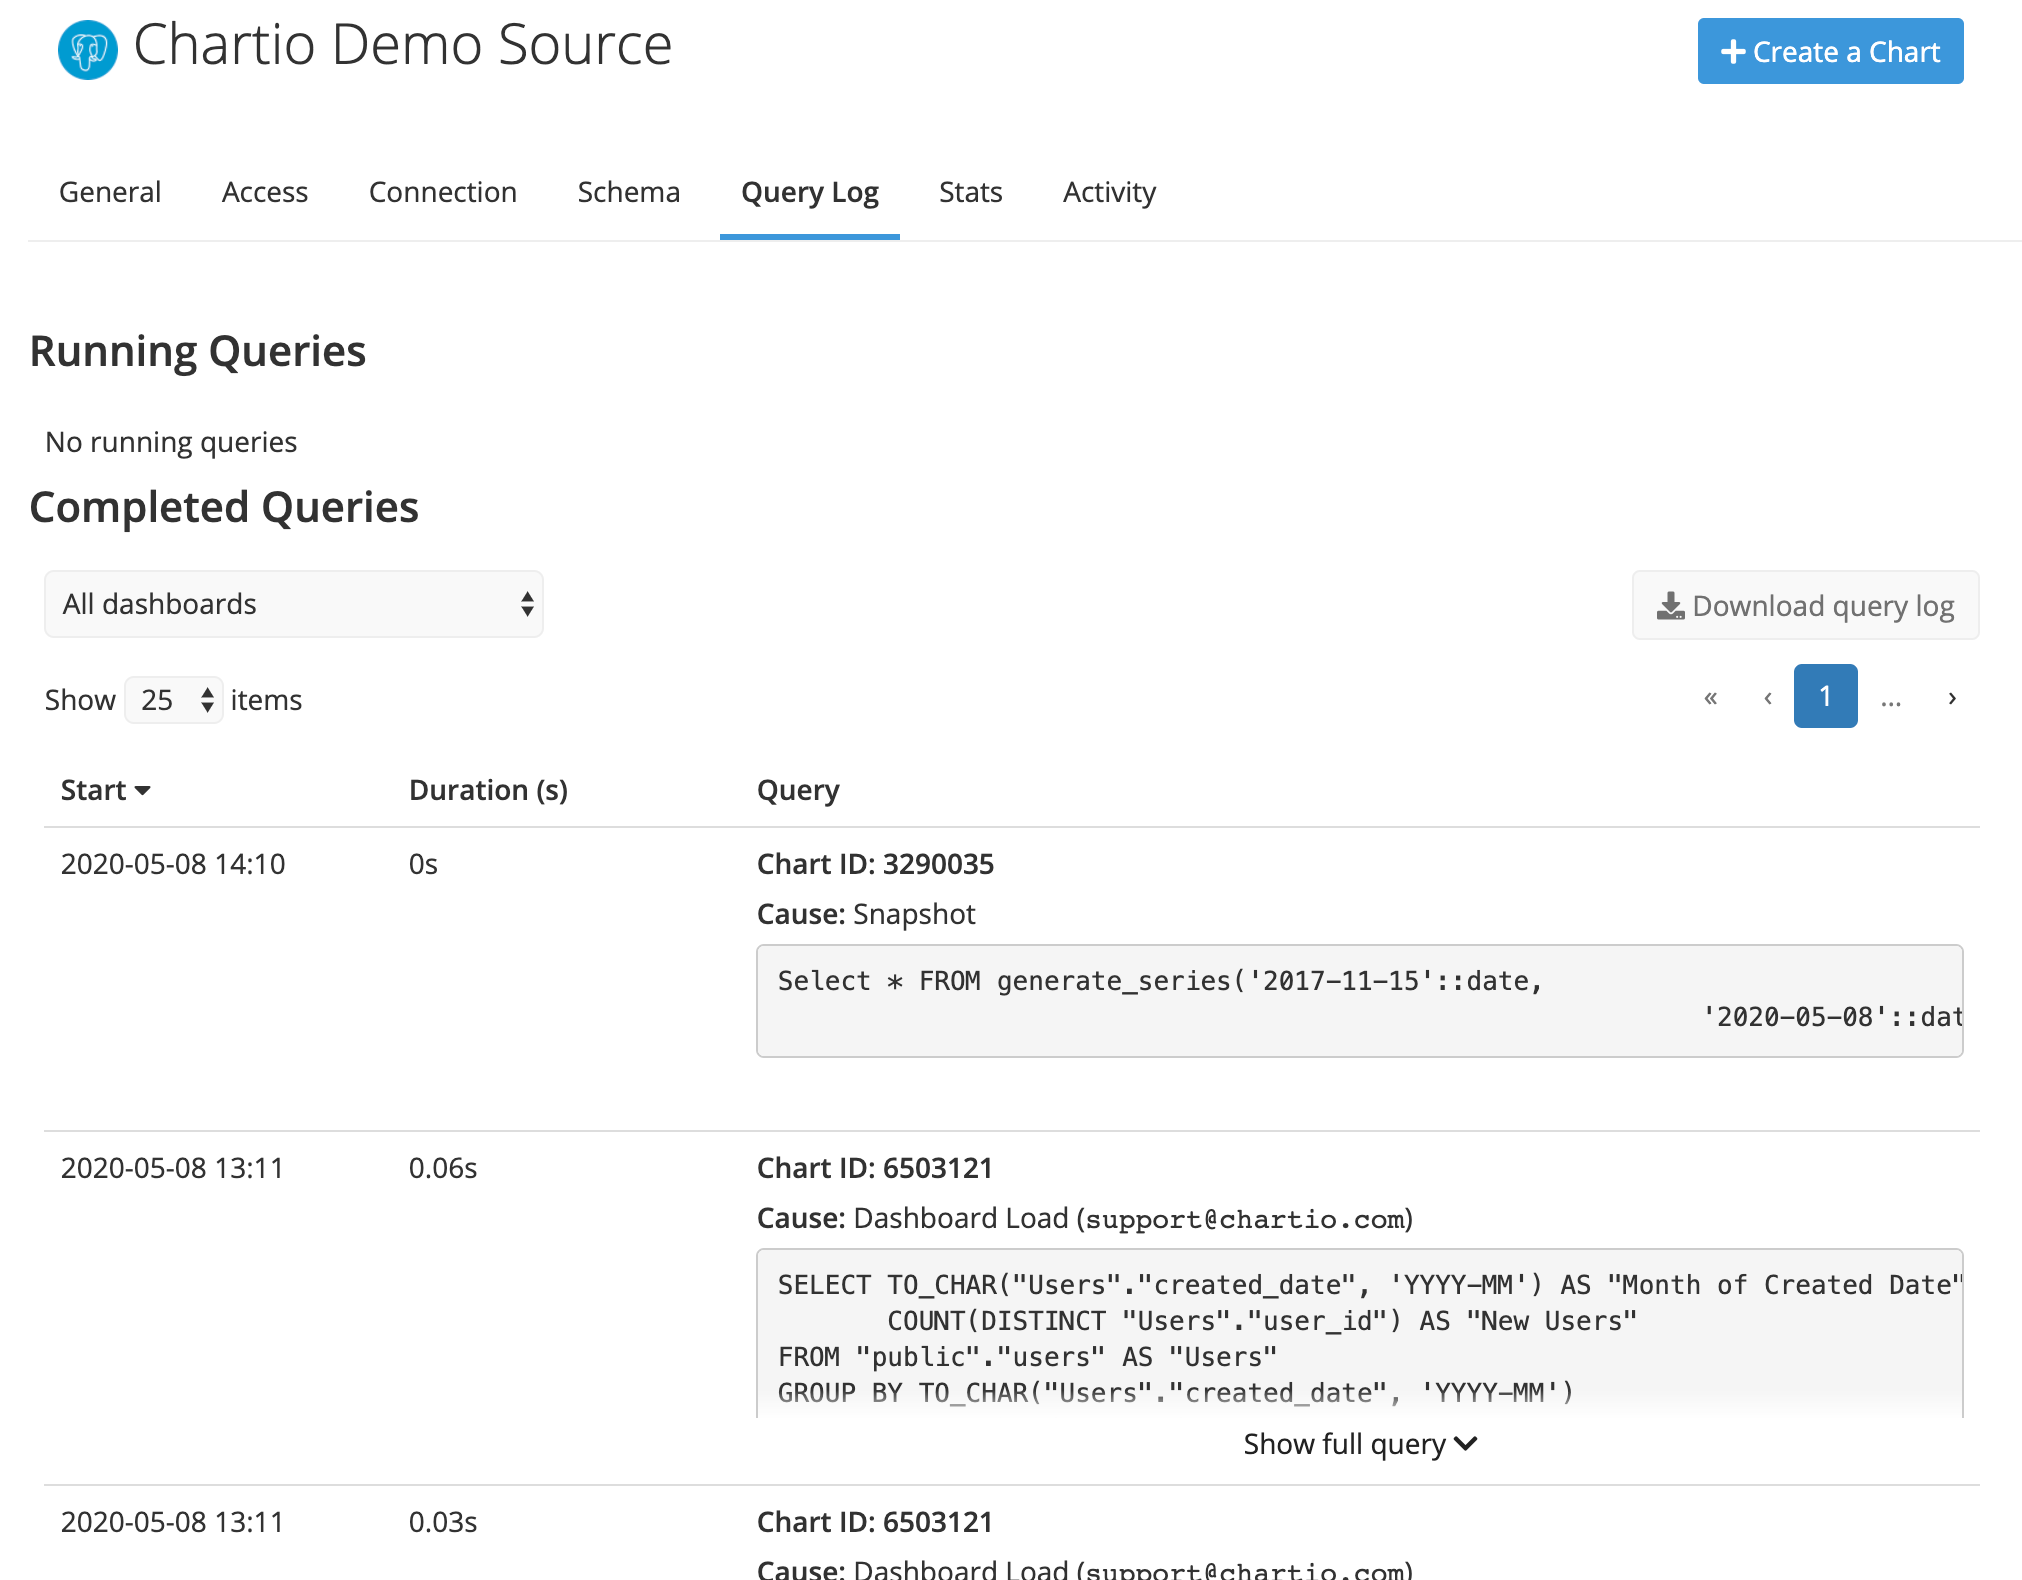
There are times when it may be helpful to view the actual queries that are sent to your data source–this is where the data source’s query log comes in handy. From the query log, you can view all the running and completed queries from the last 30 days for a particular data source, as well as other details and stats for each individual query. Chartio also allows you to view and download the query log as a CSV file.
To view a data source’s query log, do the following:
- Click Data from the top navigation bar
- Choose one of your data sources from the list
- Click Query Log
Cancel running queries
Another feature of the query log is that it allows you to monitor the duration of any queries that are currently running, and cancel them if desired.
Occasionally a database does not respond to a cancel query request from Chartio. MySQL, in particular, requires an open connection to send a cancellation request; if there is no open connection available (because many queries are running), the request will be unsuccessful.

View all queries
Under Completed Queries, you can view query information for all queries run for the selected data source. By default, the queries for every chart in every dashboard are shown in the list. You can look at the queries for a specific dashboard by selecting it in the dashboard dropdown.

You’ll be able to view the Start Time, Query SQL, Errors (if any), and Query Duration. Query Duration includes only the time it takes your database to run the query—it does not include chart rendering time. You can also filter by dashboard or chart in the dropdown menus if you’re troubleshooting for a particular chart. The Query column also contains links back to the chart and dashboard.
Download the query log
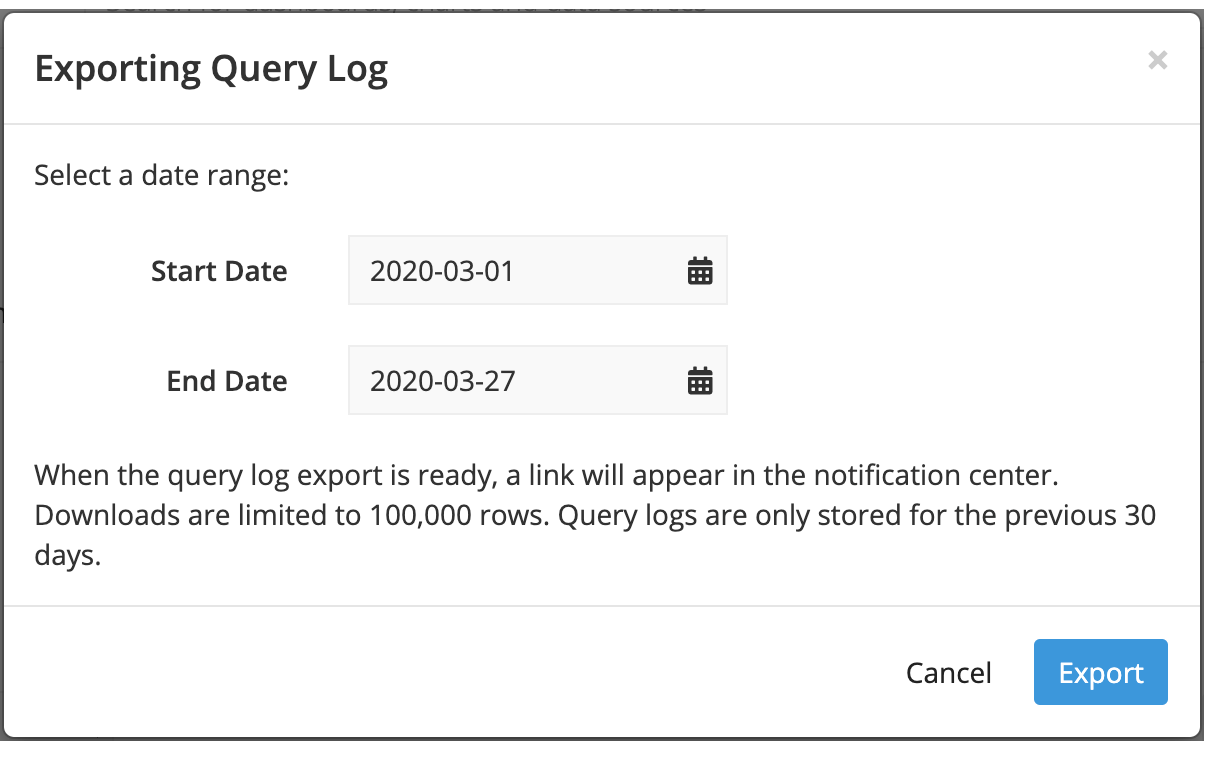
You can download the query log as a CSV, and even upload it back to Chartio to analyze your query data. Just click Download query log, select a date range (you can download up to the last 30 days of the Query Log), then click Export.

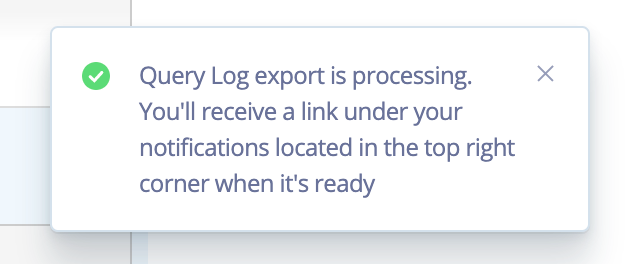
A pop-up will appear in the corner informing you the query log is processing.

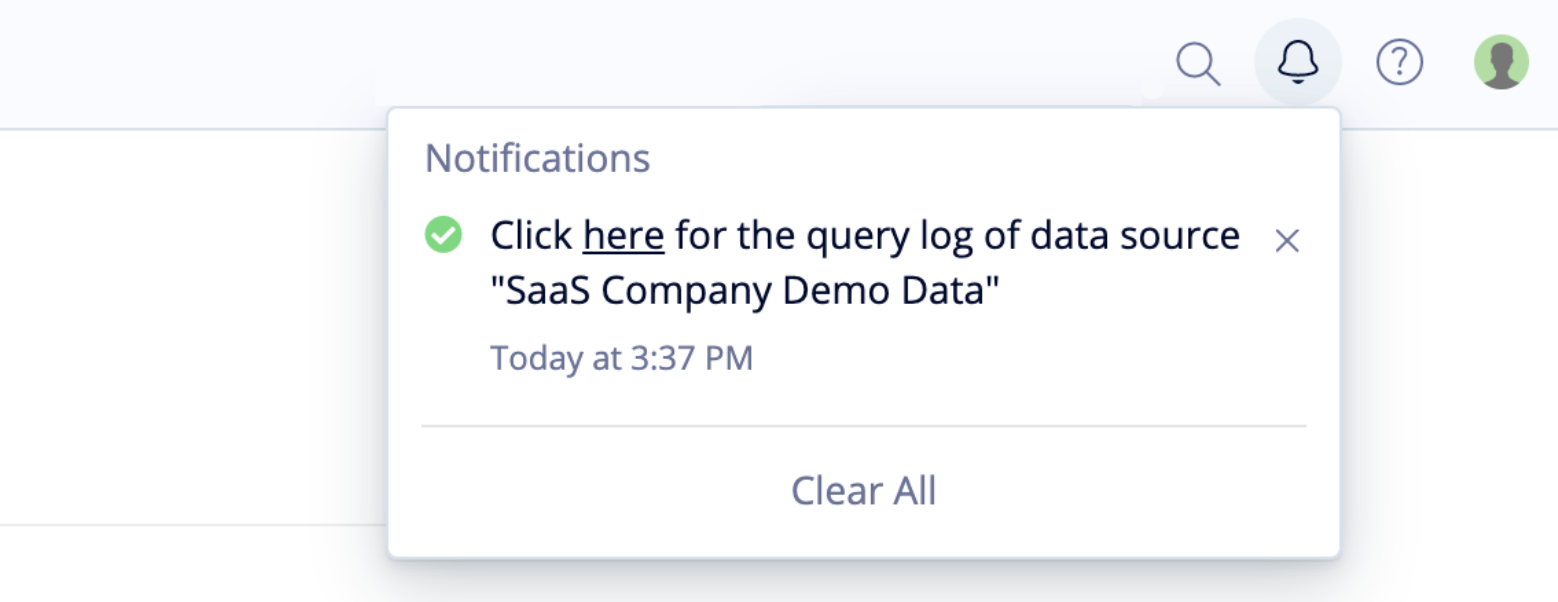
When the file is ready, you’ll receive a notification in the top-right corner. Click the Bell to view the notification and click the link to download the CSV file.
