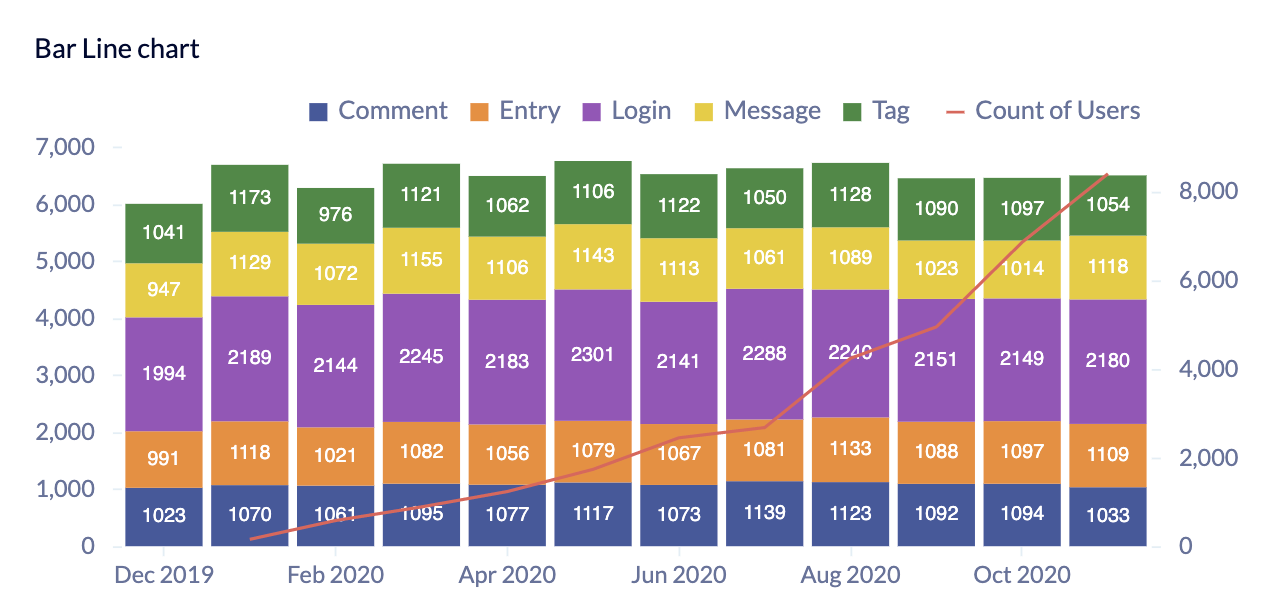
Bar Line Chart Settings (Vega)
| General | Legend | Axis | Color |
| Series | Drilldown | Annotation |
General
“Chart title”, “Title font size”, “Chart subtitle”, “Subtitle font size”, and “Show tooltips” can be found in the General section of our Chart Settings page.
- Stacked
- When selected, stacks each Bar layer. (See the Bar chart’s General settings for more info about stacked Bar charts)
- Percentage
- Changes your y-axis to show percentages (visually, x-axis if Horizontal is selected)
-
Charts with a percentage axis are sometimes called 100% stacked charts and are useful for displaying ratios without focusing on individual values.
Legend
“Show legend” and “Placement” can be found in the Legend section of our Chart Settings page.
Axis
X Axis
“Title”, “Rotate labels”, “Hide labels”, “Min”, “Max”, “Steps”, “Date format”, “Data format”, “Number format”, and “Rounding” can be found in the Axis section of our Chart Settings page.
- Log axis
- Available when the x-axis labels are numeric
-
Displays the x-axis on a logarithmic scale
Y Axis
“Title”, “Rotate labels”, “Hide labels”, “Min”, “Max”, “Steps”, “Data format”, “Number format”, and “Rounding” can be found in the Y Axis (Left) section of our Chart Settings page.
- Log axis
- Editable when Stacked is unselected
-
Displays the y-axis on a logarithmic scale
Y Axis 2
Available when Dual Y-axis is selected
- Title
- Title for the right y-axis
- Rotate labels
- Rotate the y-axis labels by -45, -30, 30, or 45 degrees—or don’t rotate them at all
- Hide labels
- When selected, hides the right y-axis labels
- Min
- Specify the minimum value of your y-axis
- Max
- Specify the maximum value of your y-axis
- Steps
- Specify the number of steps to show between your Min and Max values
- Log axis
- Editable when Stacked is unselected
-
Displays the y-axis on a logarithmic scale
- Data format
- Choose how your values are displayed
- Number
- Percentage: Multiplies the values by 100 and appends a
% - Currency
- None (no format)
- Custom
- Number format
- Choose how your numbers are displayed
- 1,234.56
- 1234.56
- 1234,56
- 1.234,56
- 1 234,56
- 1’234.56
- Rounding
- Choose how to round your values—or don’t round
- 1k
- No Rounding
- Round to Integers (1000)
- 2 decimal places
- 3 decimal places
Color
“Background color” and “Use custom colors” can be found in the Color section of our Chart Settings page.
Series
- Show dots
- Shows dots on the line
- Linear interpolation
- Choose the type of interpolation for your chart:
- No interpolation (linear): Uses the least number of data points, resulting in more jagged lines
- Step: No slopes; jumps from one value to the next halfway through
- Cardinal (smoothed): Uses more data points than Linear interpolation, resulting in smoother lines
- Line weight
- Specify the boldness of the line
- Use custom styles
- Style your lines
- Solid
- Dashed
- Dotted
- Dual Y-axis
- Selected by default; if deselected, the line will use the same range values as the left y-axis, which may make it more difficult to spot trends in your line
- Last X columns as lines
- Turns the specified number of columns into lines
-
Default value is 1, meaning the last column in your result set is charted as a line
- Value labels
- Shows the values of each bar directly on the chart
-

- Data format
- Available when Value labels is selected
-
Choose how your value labels are displayed
- Number
- Percentage: Multiplies the values by 100 and appends a
% - Currency
- None (no format)
- Number format
- Available when Data format for value labels is Number
-
Choose how the numbers in your value labels are displayed
- 1,234.56
- 1234.56
- 1234,56
- 1.234,56
- 1 234,56
- 1’234.56
- Currency format
- Available when Data format for value labels is Currency
-
Choose a currency symbol to prepend to your value labels
- $ (USD)
- € (EUR)
- ¥ (JPY)
- £ (GBP)
- ₪ (ILS)
- R$ (BRL)
- Rounding
- Available when Data format for value labels is Number, Percentage, or Currency
-
Choose how to round your value labels—or don’t round
- 1k
- No Rounding
- Round to Integers (1000)
- 2 decimal places
- 3 decimal places
Drilldown
Check out Drilldowns for more information on this tab.
Annotation
Check out the Annotation section from the Chart Settings page for more details.