Measures and Dimensions in Data Explorer
When exploring your data or creating a new chart, new users are often confused about what should be added in the different sections of the chart builder. The answer is it depends on what you are trying to accomplish. If you would like the field summarized in some way, add it to the Measures section and select your aggregation. If you’d like to group your output based on a field, add the field to the Dimensions section.
Measures are the numerical values that quantify the data set that you want to dig into. They’re usually fields containing quantitative information. For example, a sales revenue column is a measure because you can find the sum or average the data. You can think of these as the y-axis in a chart.
Dimensions are how you want to categorize or break up the data. They’re usually fields that cannot be aggregated and contain qualitative, categorical information. For example, sales region, employee, location, or date are dimensions. You can think of these as the x-axis in a chart.
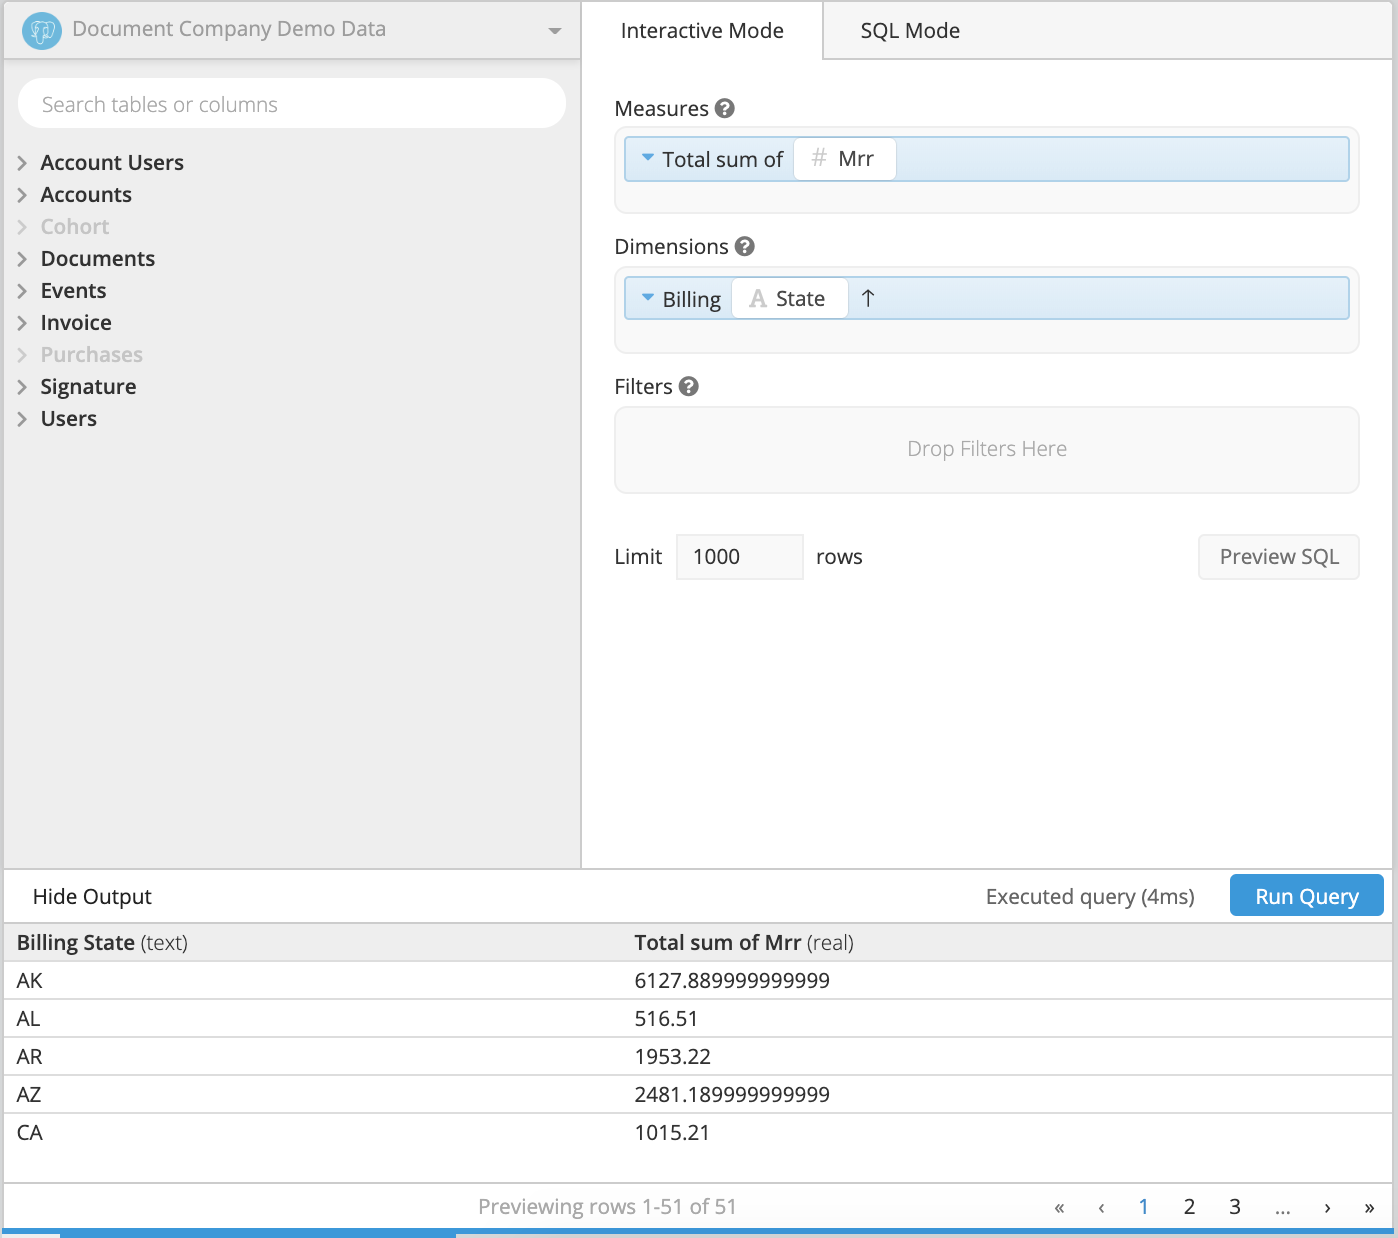
In this example, we want to sum the monthly revenue in each State, so we add the MRR field to the Measures section and select to use the sum to aggregate. In the Dimension section, we have added the state field which will result in a total revenue number for each state in your data.

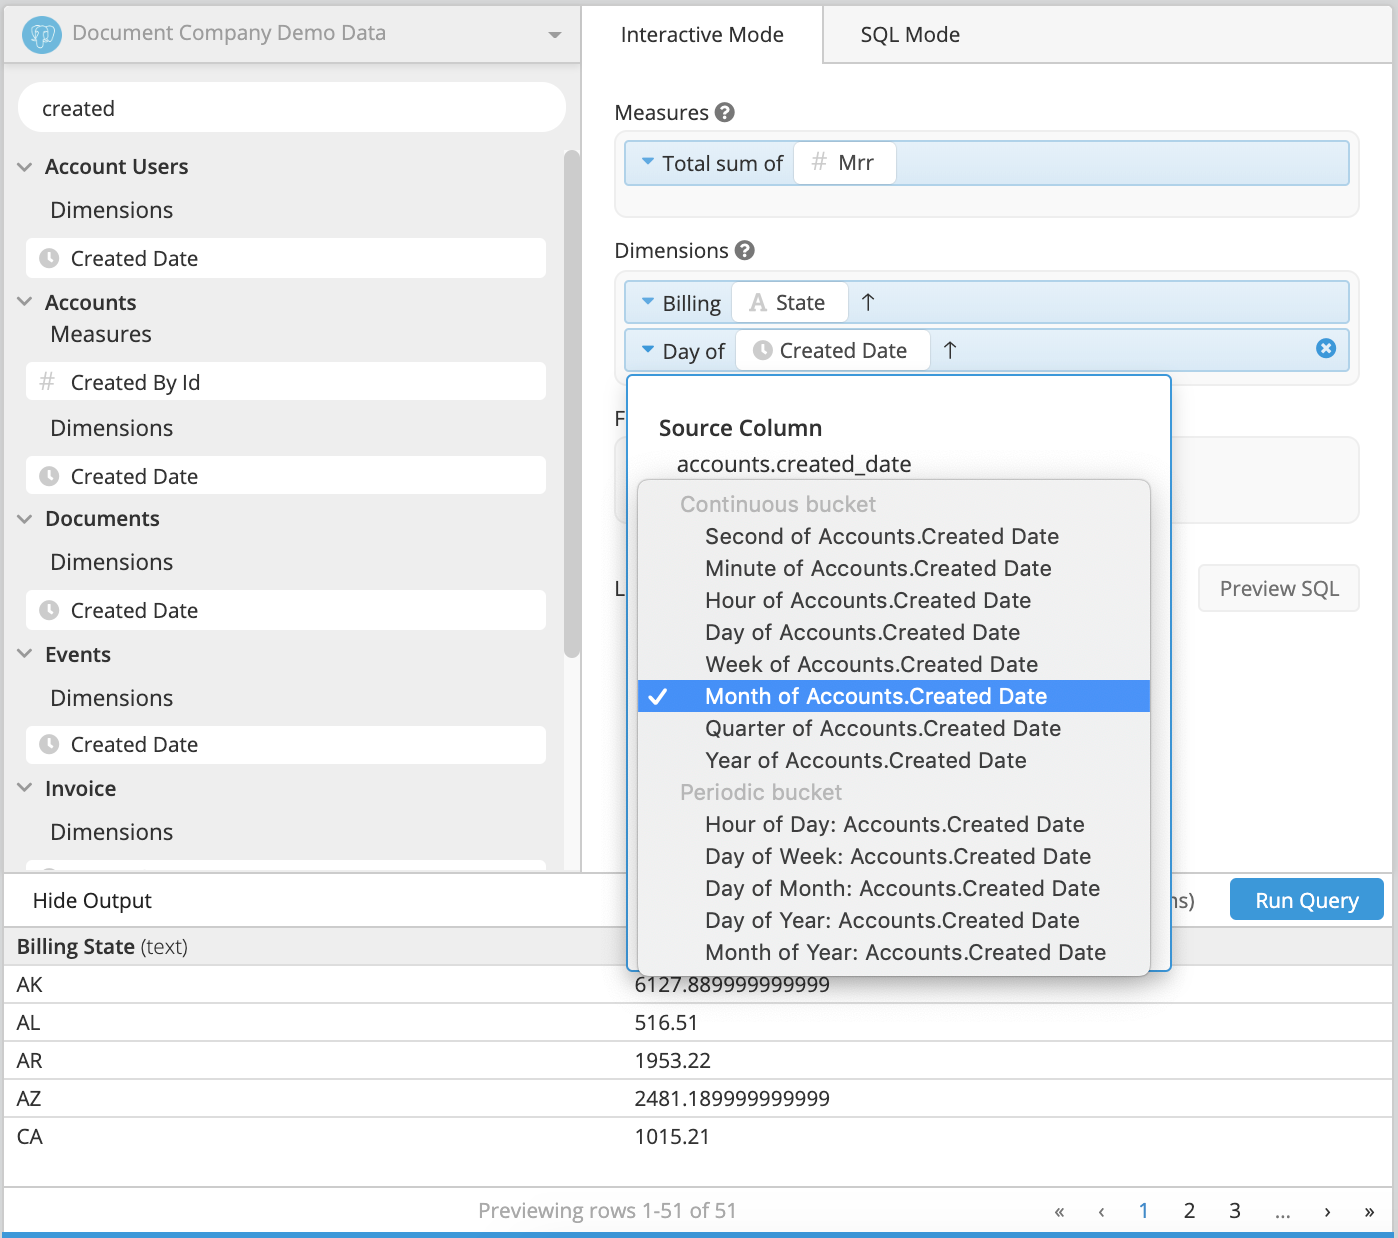
In this example, we want the results grouped by State and the created month, so we will bring the created date in to the Dimensions section as well, and select the time bucket to be ‘Month of’ the created date field.

Numerical fields can be used to group your results. You would just need to add that field in the Dimensions section. Note that this may result in many returned rows of data, because data will only be aggregated across rows with the same numerical values.