Drilldowns
Chartio’s Drilldown functionality essentially allows you to filter charts using other charts. Once set up, you can click an area on a chart to update a Dashboard Control value, and that Control can be on the current dashboard or a different one. The Control then updates any charts that are connected to it.
Setting up a Drilldown is a two-part process:
- Map your chart metrics (Drilldowns) to Dashboard Controls
- Filter your chart(s) with the Dashboard Controls
This is best explained with an example. We’ll start by showing you what our final dashboard looks like, then we’ll explain how to connect everything together.

Interacting with the Monthly Activity chart updates two Dashboard Controls: the Calendar and the categorical Dropdown. The Dashboard Controls then update the Daily Activity chart. This gives us a zoomed-in view of our Activity by Activity Type.
Let’s walk through how to set this up. To begin with, we have two charts and two Dashboard Controls already on this Dashboard:
- Monthly Activity, a chart grouped by month and activity type
- Daily Activity, a chart grouped by day and activity type
- A Calendar Dashboard Control
- A categorical Dropdown Dashboard Control containing Activity values
1. Connecting your Drilldown to Dashboard Controls
First, we want to connect Monthly Activity to our two Dashboard Controls. This will allow our chart to update the Dashboard Controls whenever we click somewhere inside the Monthly Activity chart.
We’ll click the ellipsis menu on our Monthly Activity chart and select Edit Settings from the context menu.

We’ll then switch to the Drilldown tab in the Chart Settings modal. This tab allows you to map Dashboard Controls to Drilldowns (your chart metrics).

We want to link two Dashboard Controls to our chart: ACTIVITY (the categorical Dropdown) and CALENDAR.
- On our chart, Activity is the series (pivoted column), so we’ll choose series from the dropdown for ACTIVITY.
- Our dates are on the x-axis, so we’ll choose x-value from the dropdown for CALENDAR.
Note: If your chart has x and y-axis labels, you’ll see those label names listed instead of ‘x-value’ and ‘y-value’.
Link to another dashboard
To link your Drilldown chart to another dashboard, simply choose the dashboard from the Linked Dashboard dropdown in the Drilldown tab of your chart settings. You’ll need to first add the necessary Dashboard Controls to the Linked Dashboard so your chart can update them.
You also have the option to additionally pass all the current values of the other Dashboard Controls on the Drilldown dashboard to your linked dashboard. Select Pass all variables to enable this feature. For this to work properly, the Controls on the linked dashboard and the Drilldown dashboard must be the same (name and settings) and, if the Control is not connected directly to the Drilldown chart, it should be set to No effect in the Drilldown tab.
X-values, y-values, and series
Generally, x-values map to the x-axis, y-values to the y-axis, and series to the columns.
If you aren’t sure you’re selecting the correct chart metric to map to your Dashboard Control, check the sample values listed below the Drilldown Variables dropdown to confirm.
If your chart has x and y-axis labels, those labels are also shown in the Drilldown Variables dropdown.
2. Connecting the Dashboard Controls to your other chart(s)
We want our Daily Activity chart to update when the Dashboard Controls change, so we’ll just need to filter our chart by our two Dashboard Controls.
On our Daily Activity chart, we’ll click the ellipsis menu and choose Edit Chart Data.

- To connect our Activity Dropdown to the chart, we’ll add our Activity Name column to the Filters section:
Activity Name is one of{ACTIVITY} - To connect our Calendar variable, we’ll also add the Created Date column to the Filters section:
Created Date between and including{CALENDAR.START}and{CALENDAR.END}
Here’s what the query looks like with our filters added:
| In the Visual SQL interface |
|---|
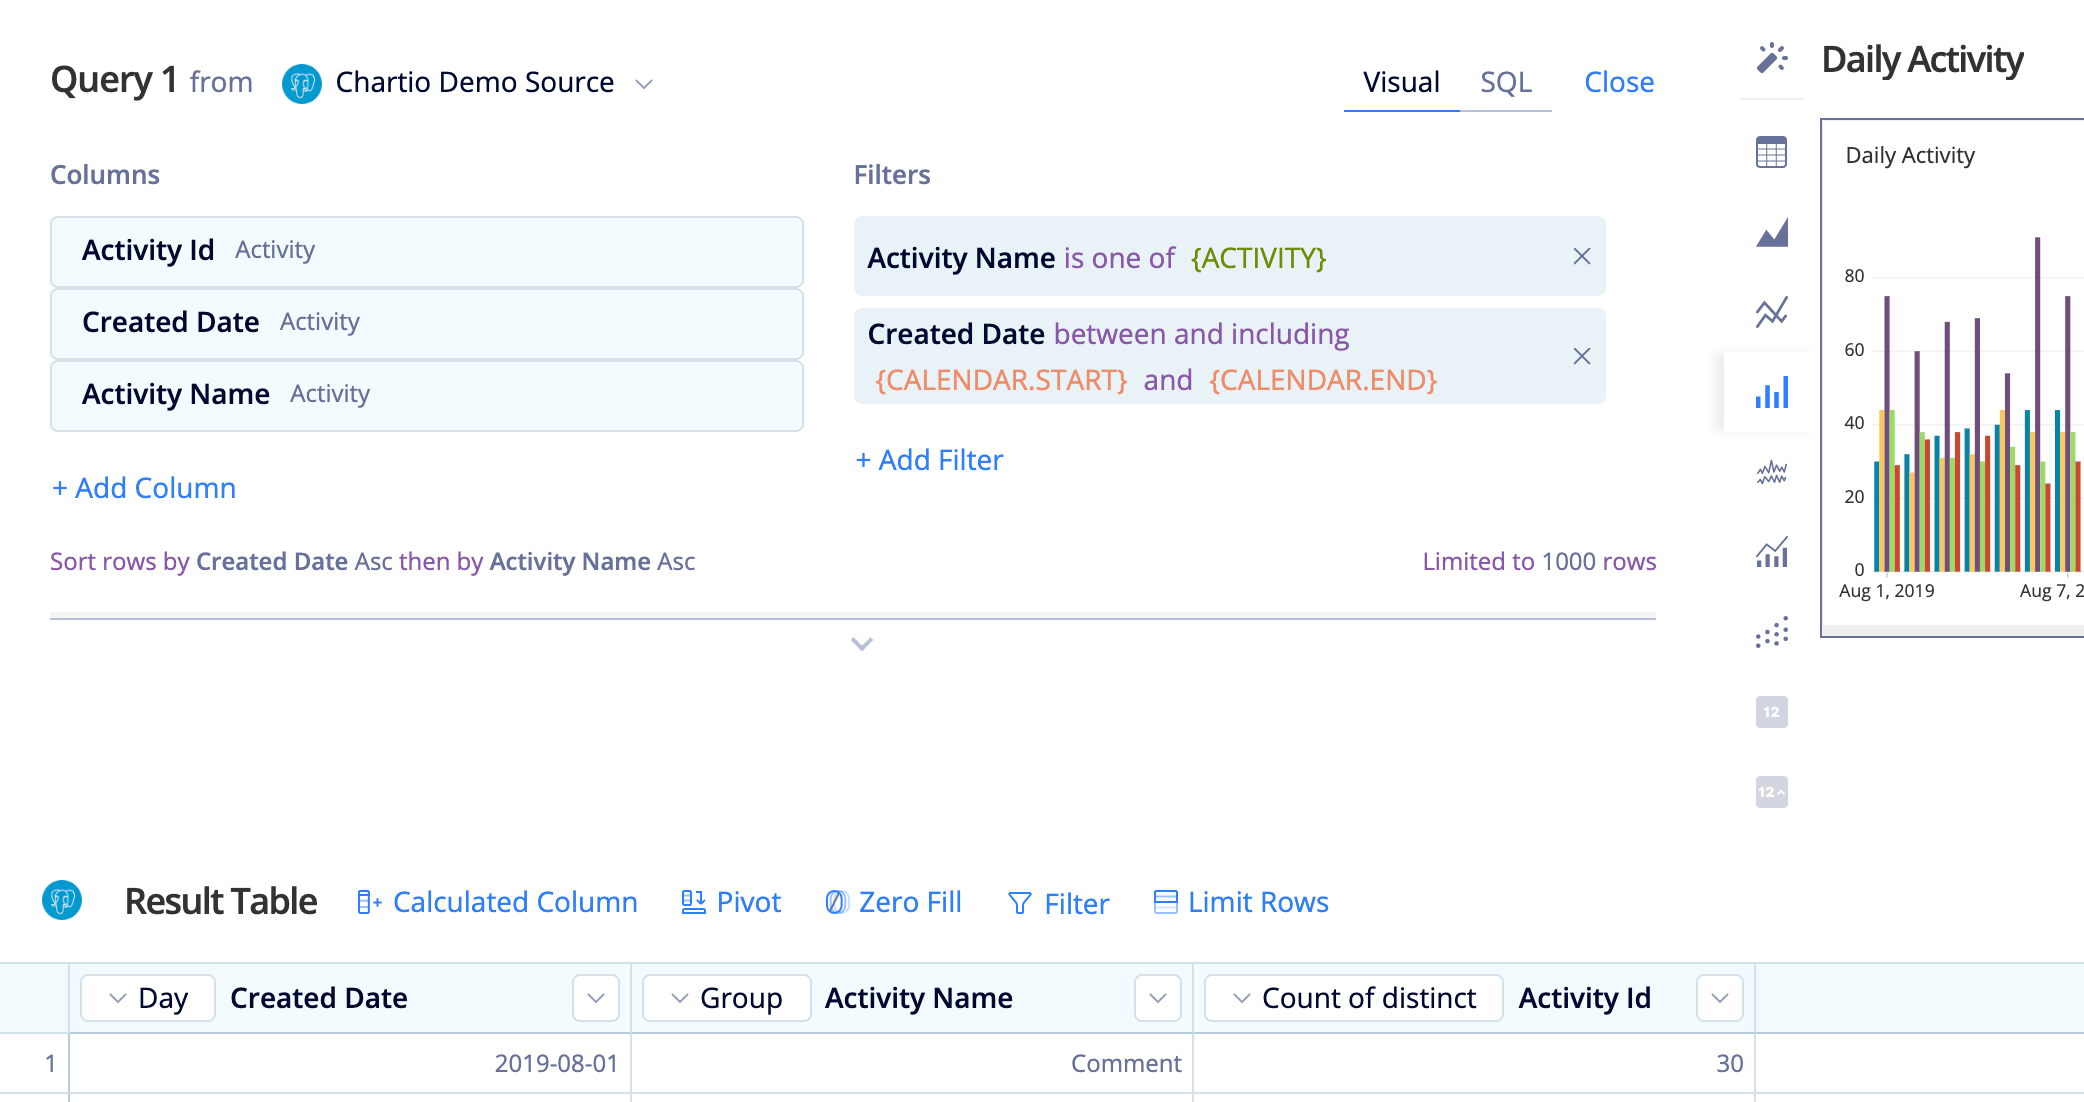 |
| In the Data Explorer interface |
|---|
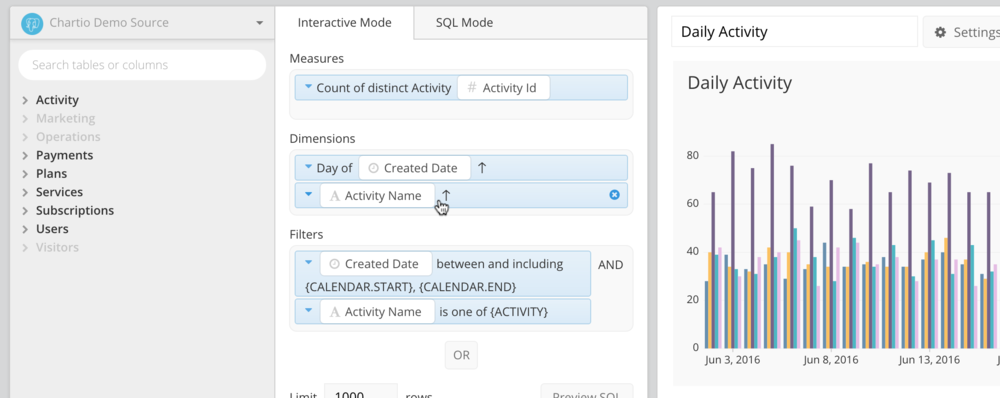 |
That’s it! Your Drilldown should work as expected.
Additional notes
- For Table charts with Drilldowns, the selections are made per-row. If more than one Drilldown is used in a Table chart, clicking a row value will update all Dashboard Controls for the row.
-
If your Table Drilldown is connected to a multi-select Dashboard Control, you can use
Cmd + clickon the Table rows to add multiple values to your Control. - If you’d like to use a Line chart or Scatter Plot for your Drilldown, you may want to edit the chart settings to increase the line width or dot size to allow for easier click interactions.
If you have any trouble setting up your Drilldowns, please feel free to send us an email at support@chartio.com.