Reusable Pipelines
Reusable Pipelines allow you to save a query and its Pipeline Steps to use as a data source in other charts. Chartio does not store the Pipeline data results; it saves the query or queries and its Pipeline Steps for reuse across charts.
Creating a Pipeline
From the top navigation menu, click Data > Pipelines > + Add Reusable Pipeline.

Adding a new Reusable Pipeline will take you into the Data Explorer in Advanced Mode where you can build your Pipeline.
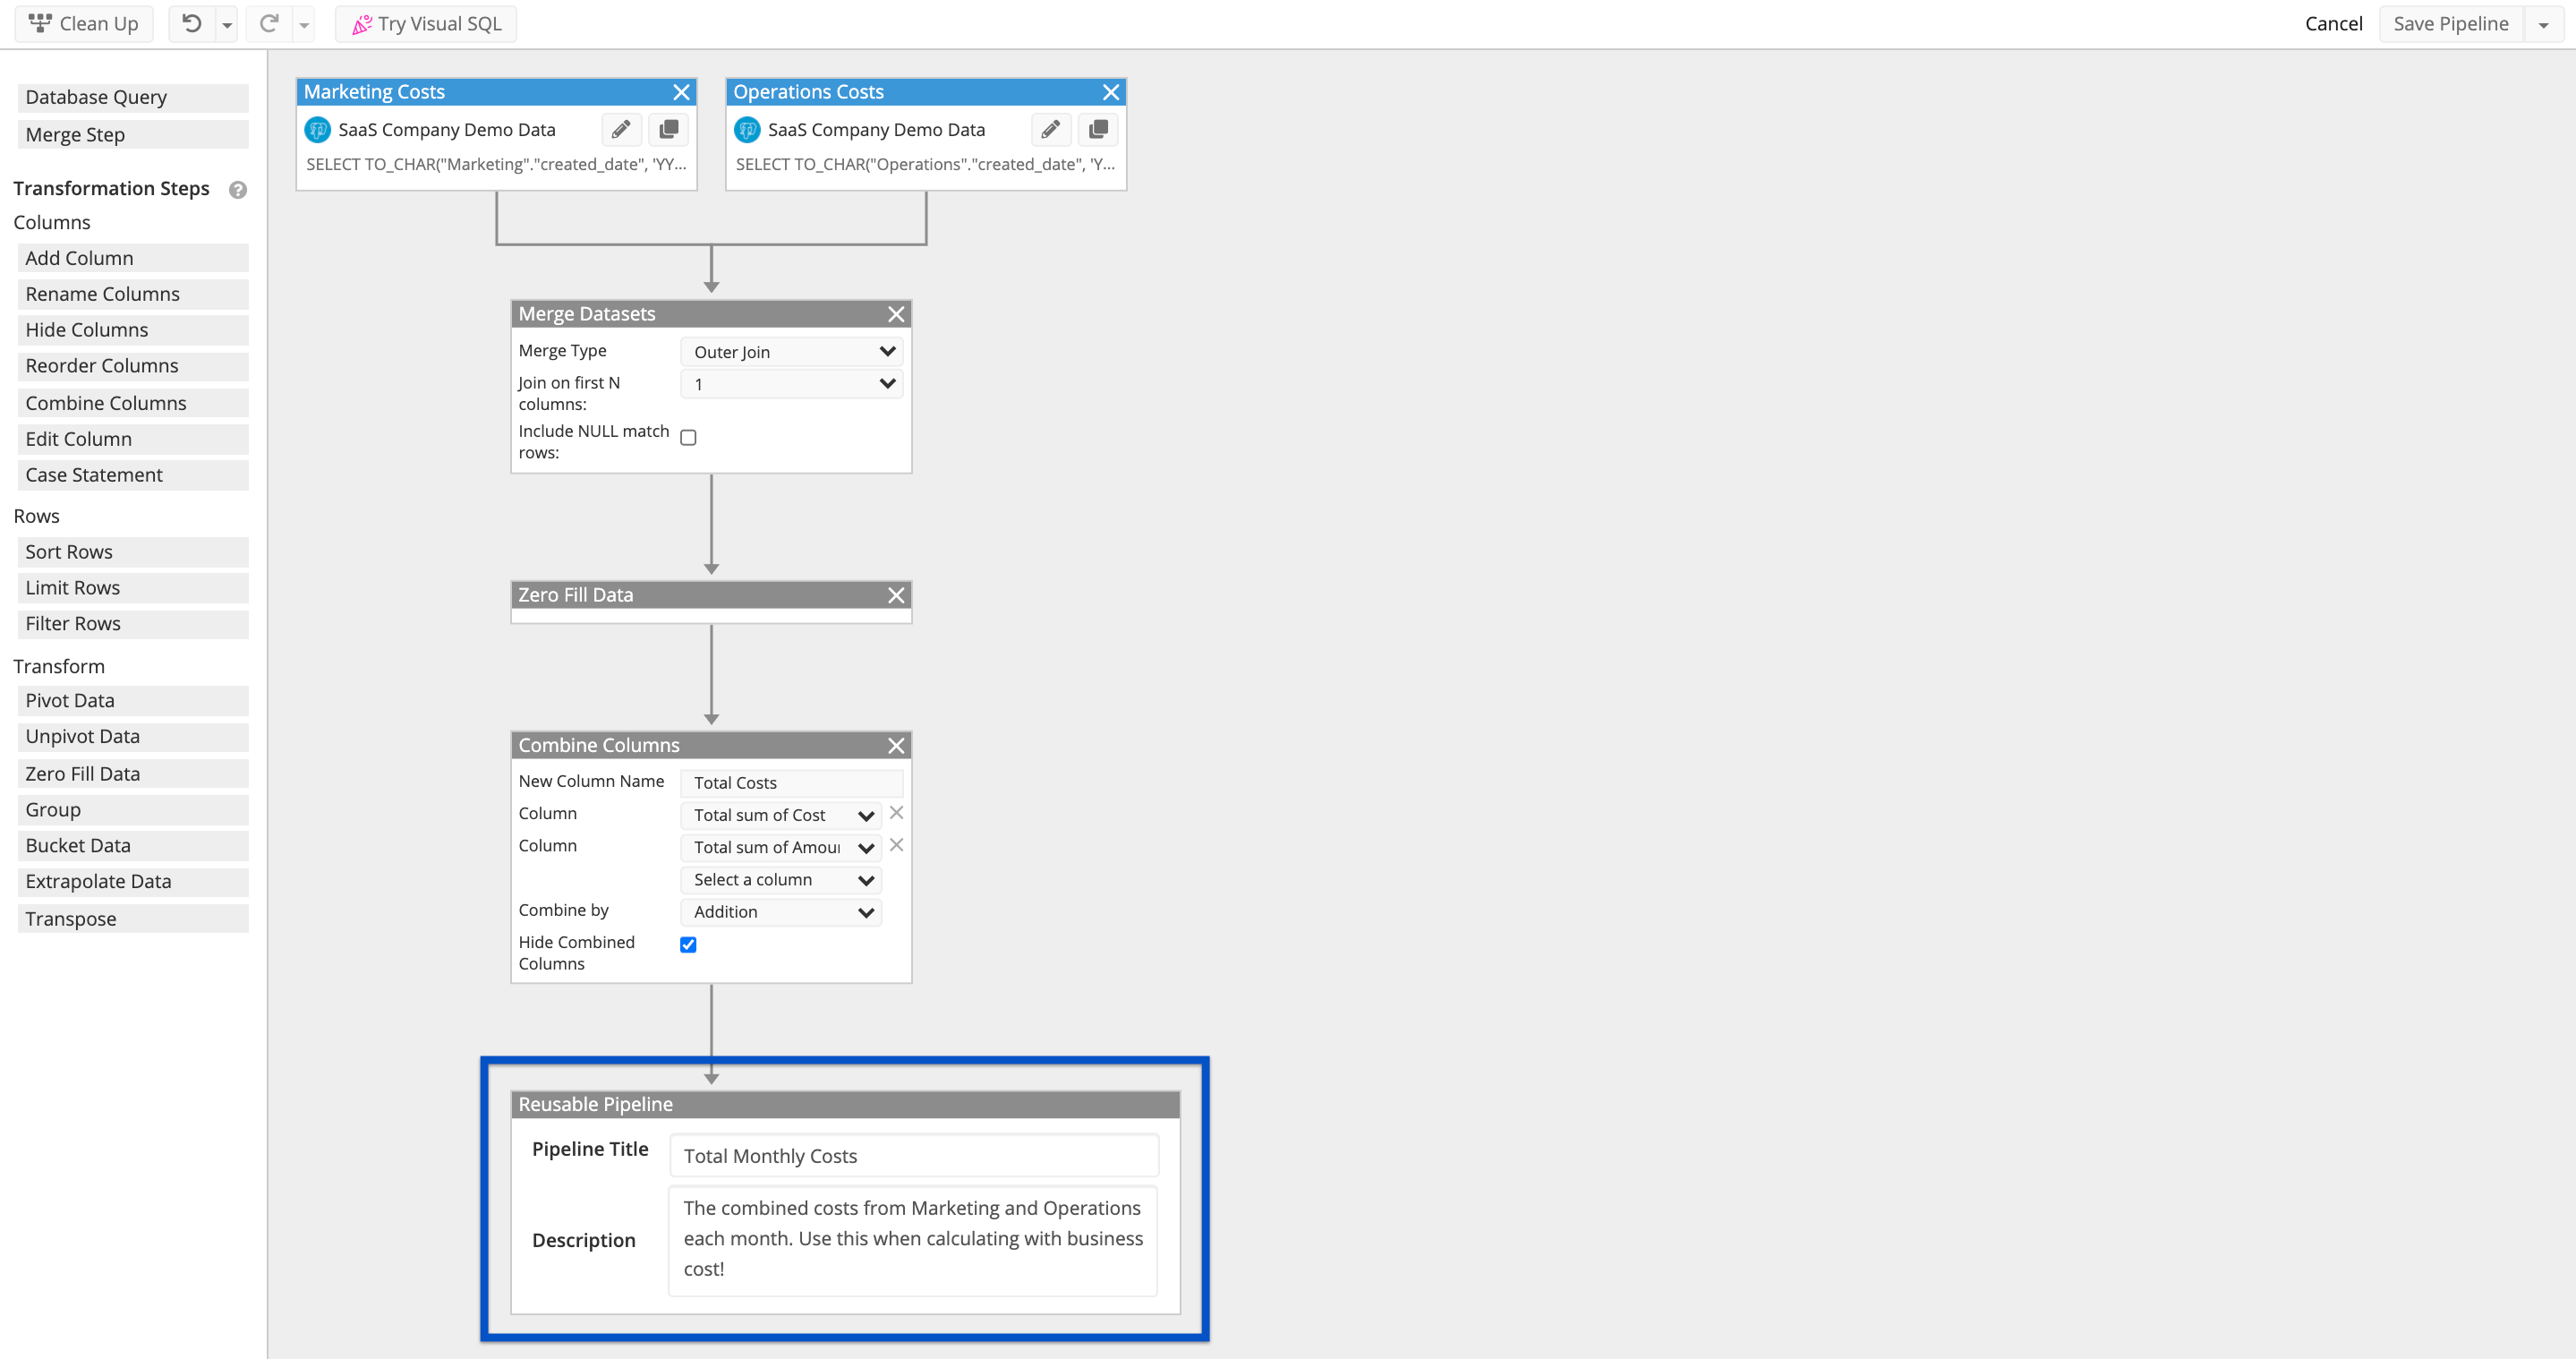
Once you’ve created your Pipeline, the last node will be the Reusable Pipeline node where you can give the Pipeline a title and a description, then click Save Pipeline.
Using a Pipeline in a Chart
Pipelines can only be used in charts that are built in Advanced Mode.
After you have created a Pipeline, open the chart editor to create a new chart. Switch to Advanced Mode and drag a Reusable Pipeline node. Once the Reusable Pipeline node has been placed on the canvas, you can select which Pipeline to use and connect with the rest of your chart.
Permissions
View the full permissions table on our Permissions page.
New Pipelines
Anyone with access to a data source can create a Pipeline using that data source.
Existing Pipelines
Using and editing a Pipeline requires access to the underlying data sources used in the Pipeline.
- Pipeline Viewers can use the Pipeline in a chart.
- Editors and Admins can edit the Pipeline and grant View or Edit access.
- Admins can grant Admin access, edit existing access, and delete the Pipeline.
- Chartio Owners may view, use, and edit any Pipeline.
Granting Access
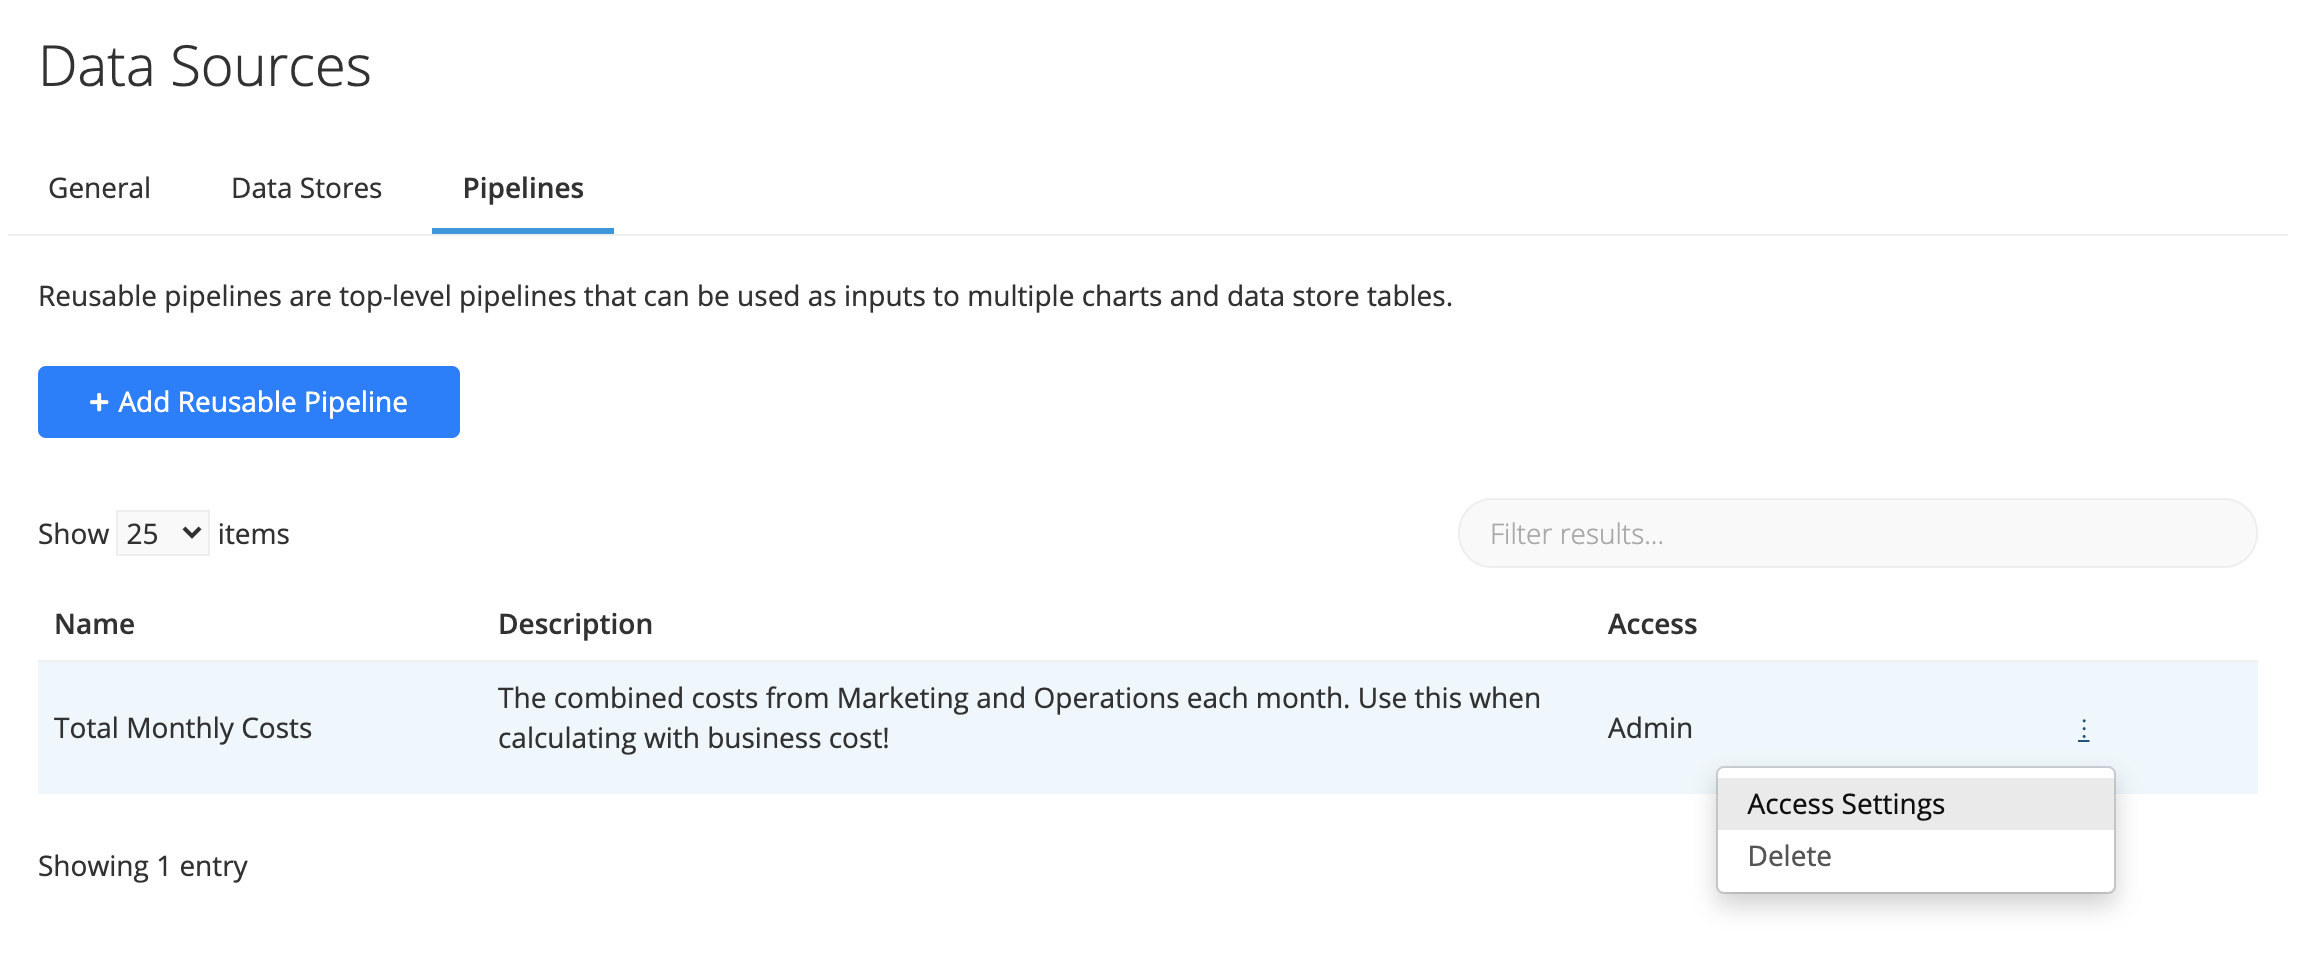
To share Pipelines with other users, navigate to the Pipelines page. From there, click the ellipsis menu to the right of the Pipeline you wish to share then click Access Settings.
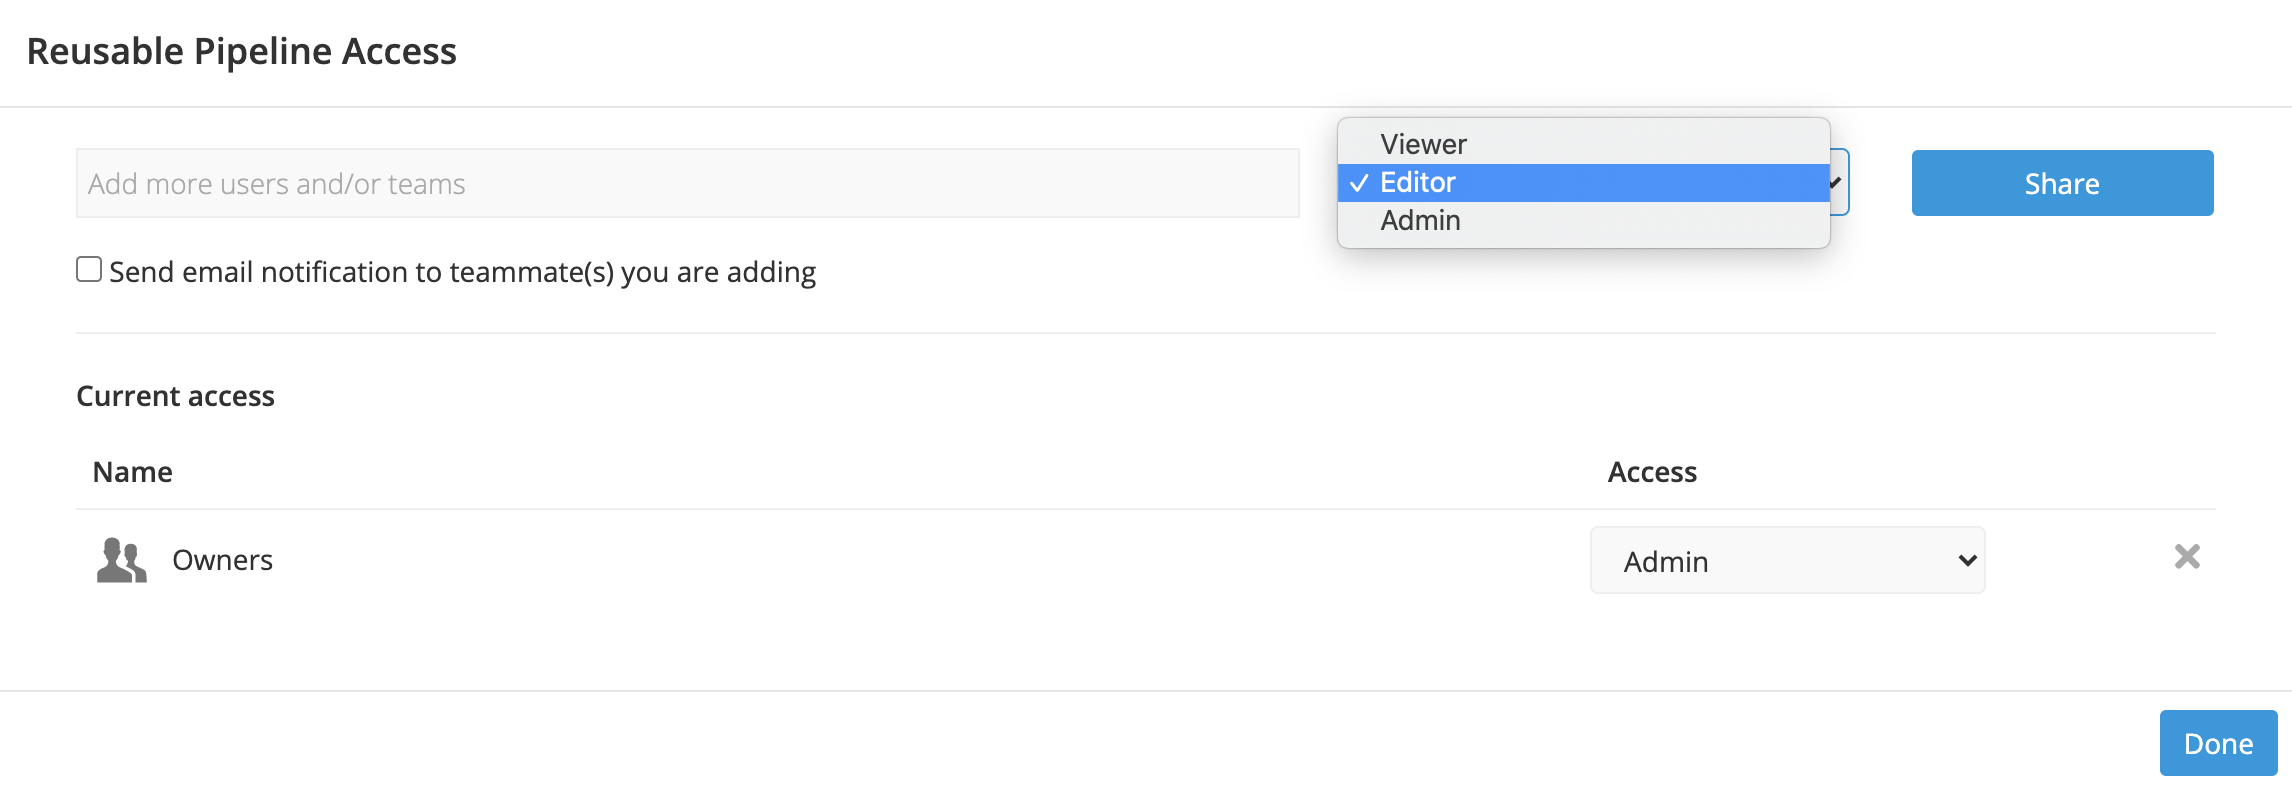
Users can have Viewer, Editor, or Admin access to Pipelines. In order for users to use Pipelines in their charts, they would need view access to the Pipeline. Editors and Admins will have access to edit/change the Pipeline and also share access to other users.
Note: Editors can only share view or editor access to the Pipeline. Only Admins can share admin access and delete Pipelines.
Example
Here we have two charts that calculate User Acquisition. Both charts display the same values but are built differently.
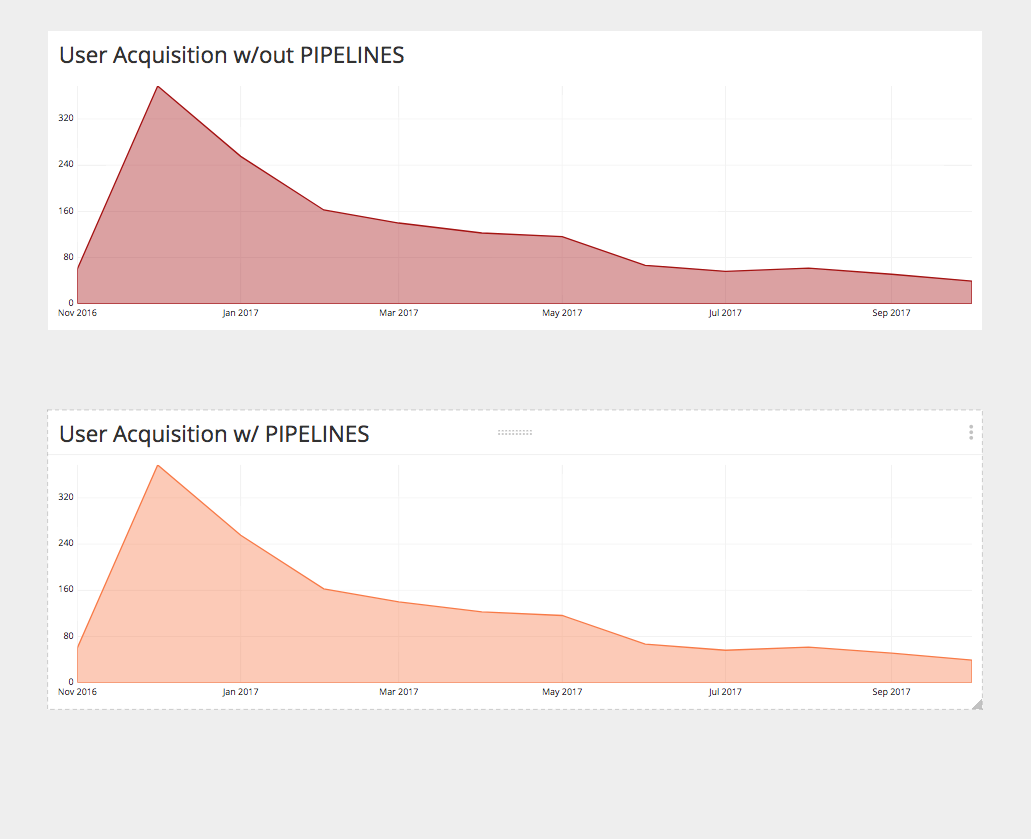
The first chart calculates User Acquisition without Reusable Pipelines.
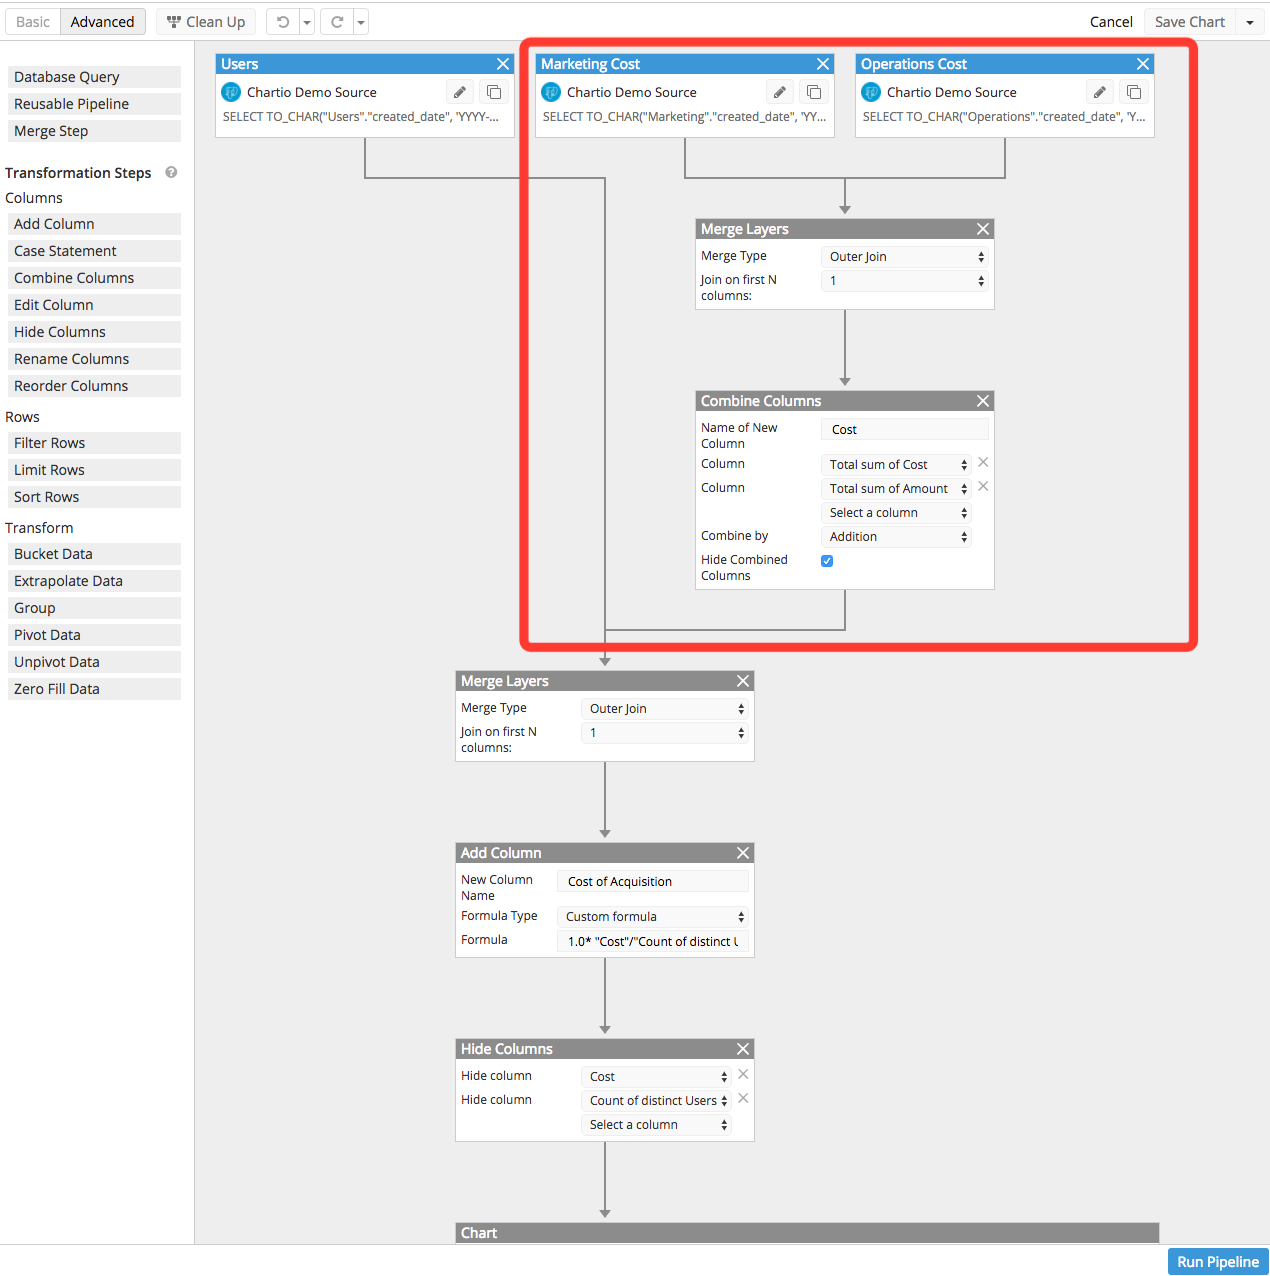
In this chart, the acquisition cost is calculated by combining Marketing and Operations cost and then joining that cost with Users. This requires a series of steps highlighted in the red box above. Other users wanting to calculate this cost or use this cost in their charts would need to repeat the steps. This makes the chart more complicated and difficult to enforce if the definition of acquisition were to change in the future. Instead, this logic can be saved and re-used as a Reusable Pipeline.
The second chart is the same as the first chart but uses Reusable Pipelines. Here, the acquisition cost is saved into a Pipeline that reduces the number of Data Pipeline Steps into one step.
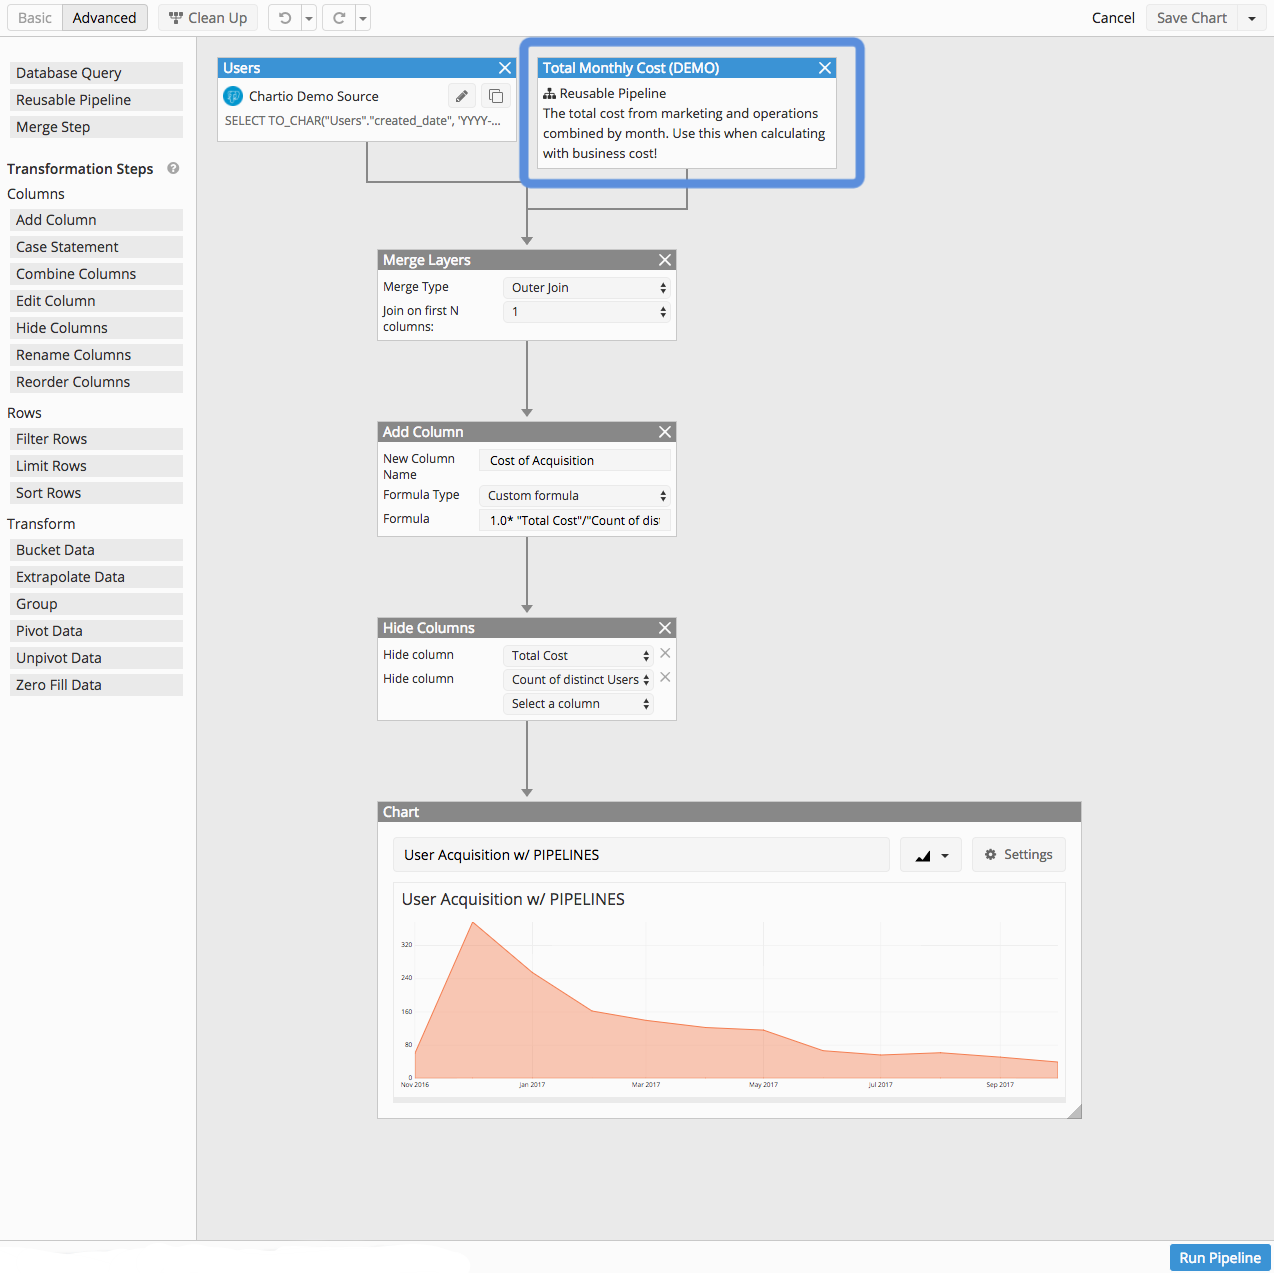
In addition to a cleaner chart, As mentioned earlier, if the definition of the acquisition cost were to change, you’d only need to update the Reusable Pipeline definition, then all charts using that Pipeline are automatically updated as soon as the Pipeline is modified—plus, the chart’s Data Pipeline looks much cleaner!