Advanced Data Pipeline
The Advanced Data Pipeline (AKA Advanced Mode) is an advanced version of our Data Explorer. It is essentially a visual workflow for processing data to build a chart. Merge and transform any number of datasets at any point in the Pipeline using the simple drag-and-drop interface. You’ll find Advanced Mode offers more flexibility when transforming your data, as there are some actions that can’t be done in Basic Mode.
Some common use cases for Advanced Mode include:
- Reordering your Datasets
- Performing multiple merges
- Testing and troubleshooting individual Pipeline Steps
- Undoing and redoing changes to your Pipeline
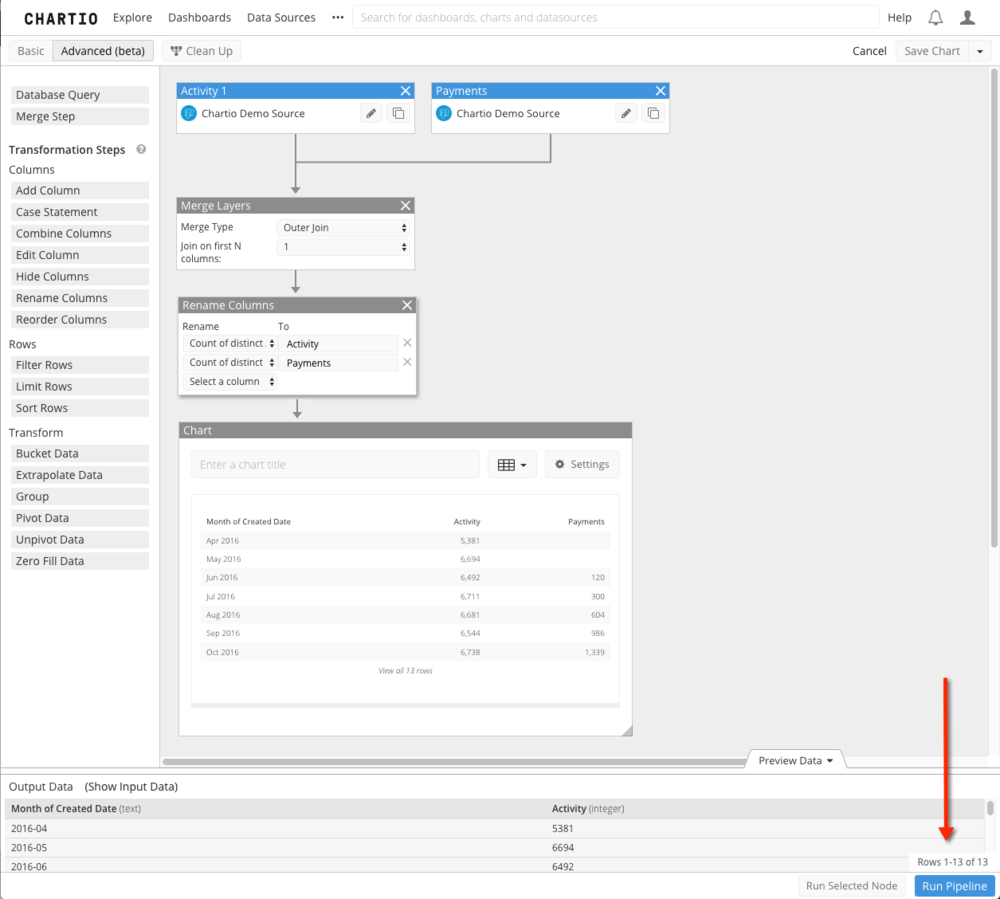
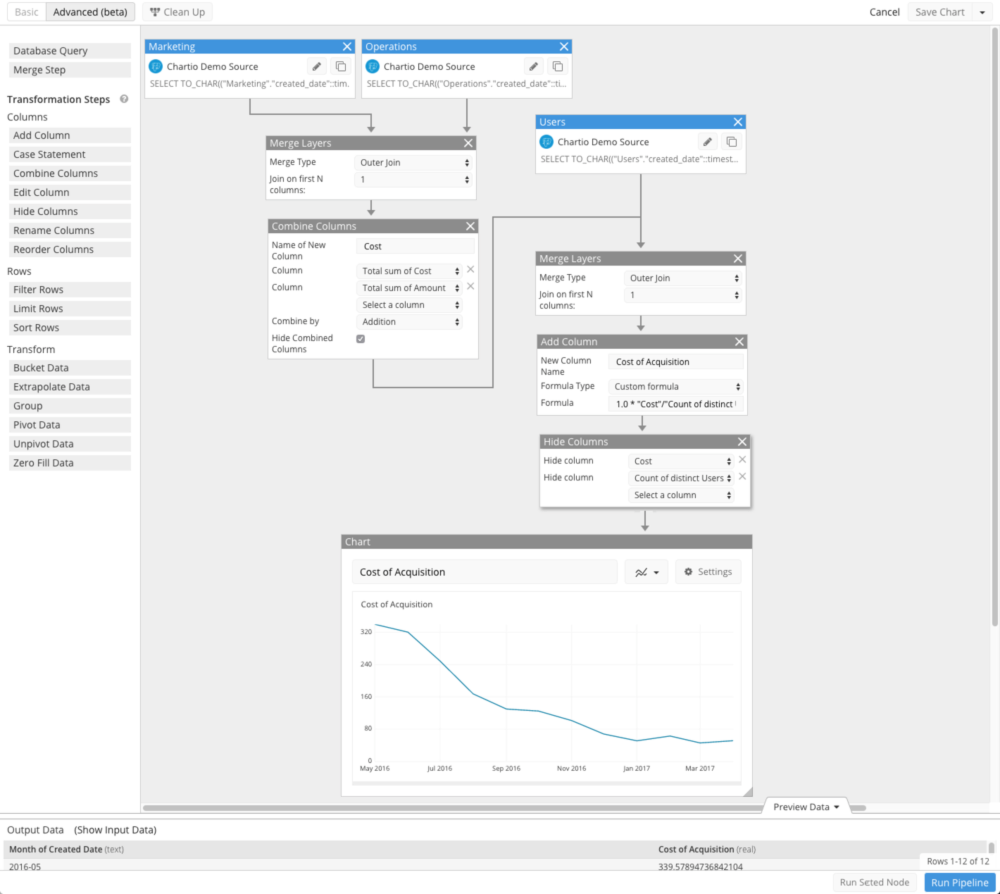
The example below shows how a user can merge two datasets, apply a transformation, then merge a third dataset.
Toggle to Advanced Mode
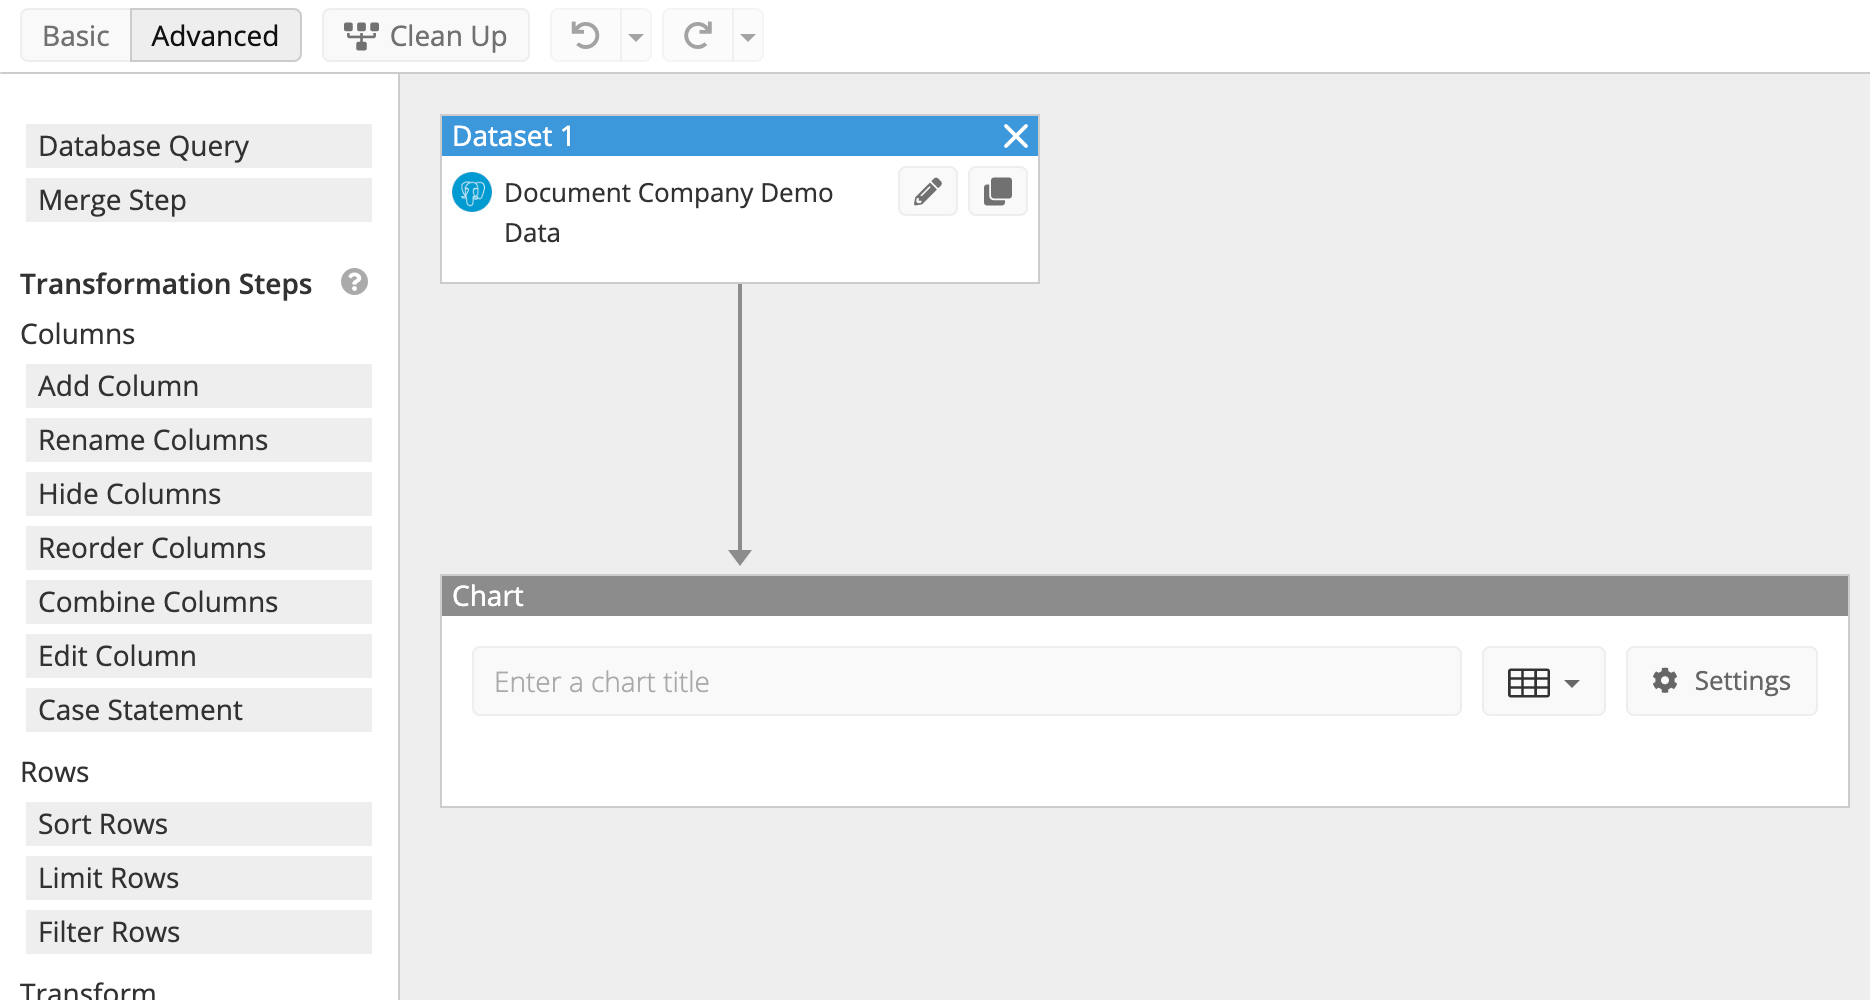
When creating a new chart from either an existing dashboard or via the Chart tab in the top navigation bar, click Advanced above the Dataset Interface to switch to the Advanced Data Pipeline view.

Once in Advanced Mode, you’ll see an empty Database Query node, which you can edit (similar to your Dataset in Basic Mode), and a Chart node on your canvas.
Note: If your Advanced Data Pipeline isn’t compatible with Basic Mode, the Basic toggle button will be disabled.
Build your Data Pipeline
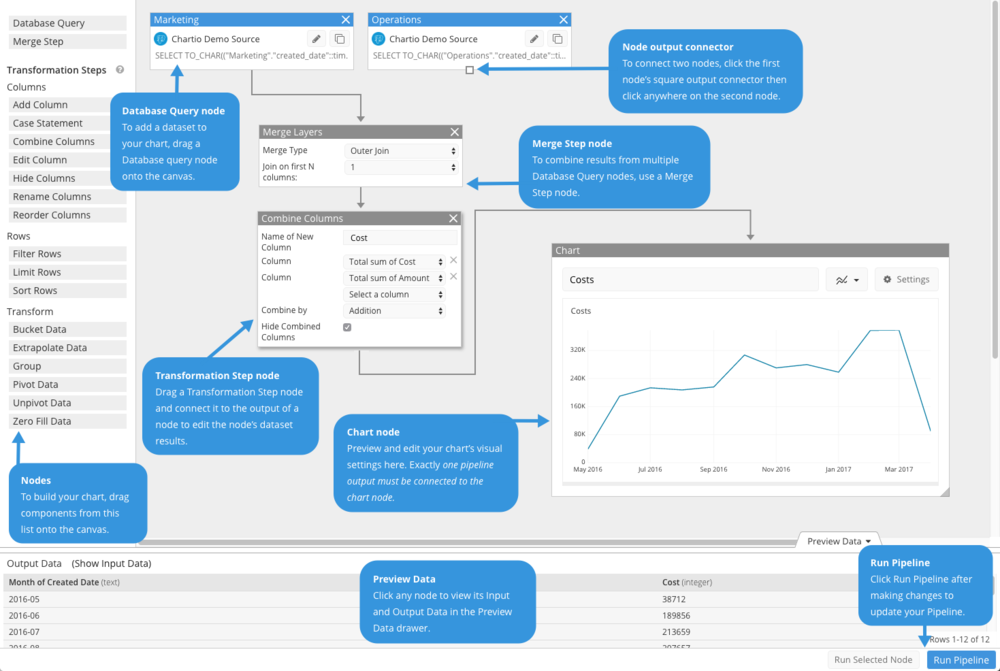
Charts are built by first dragging one or more Database Query nodes onto the canvas, combining those nodes using one or more Merge Step nodes, and connecting the final node to the Chart node. Add Transformation Step nodes as needed to modify your dataset results. Just like in Basic Mode, you start by editing your initial Database Query node. From there, you can add more nodes to your canvas and reorder them to get your desired result set.
Add a node
To add a node to the canvas, click and drag it from the left sidebar onto the canvas.
Connect nodes
When adding new nodes, connections to the new node are already made if you placed it on the connection of two existing nodes. You’ll know this will happen when you drag the new node over the connection and the connection line turns from solid to dashed.
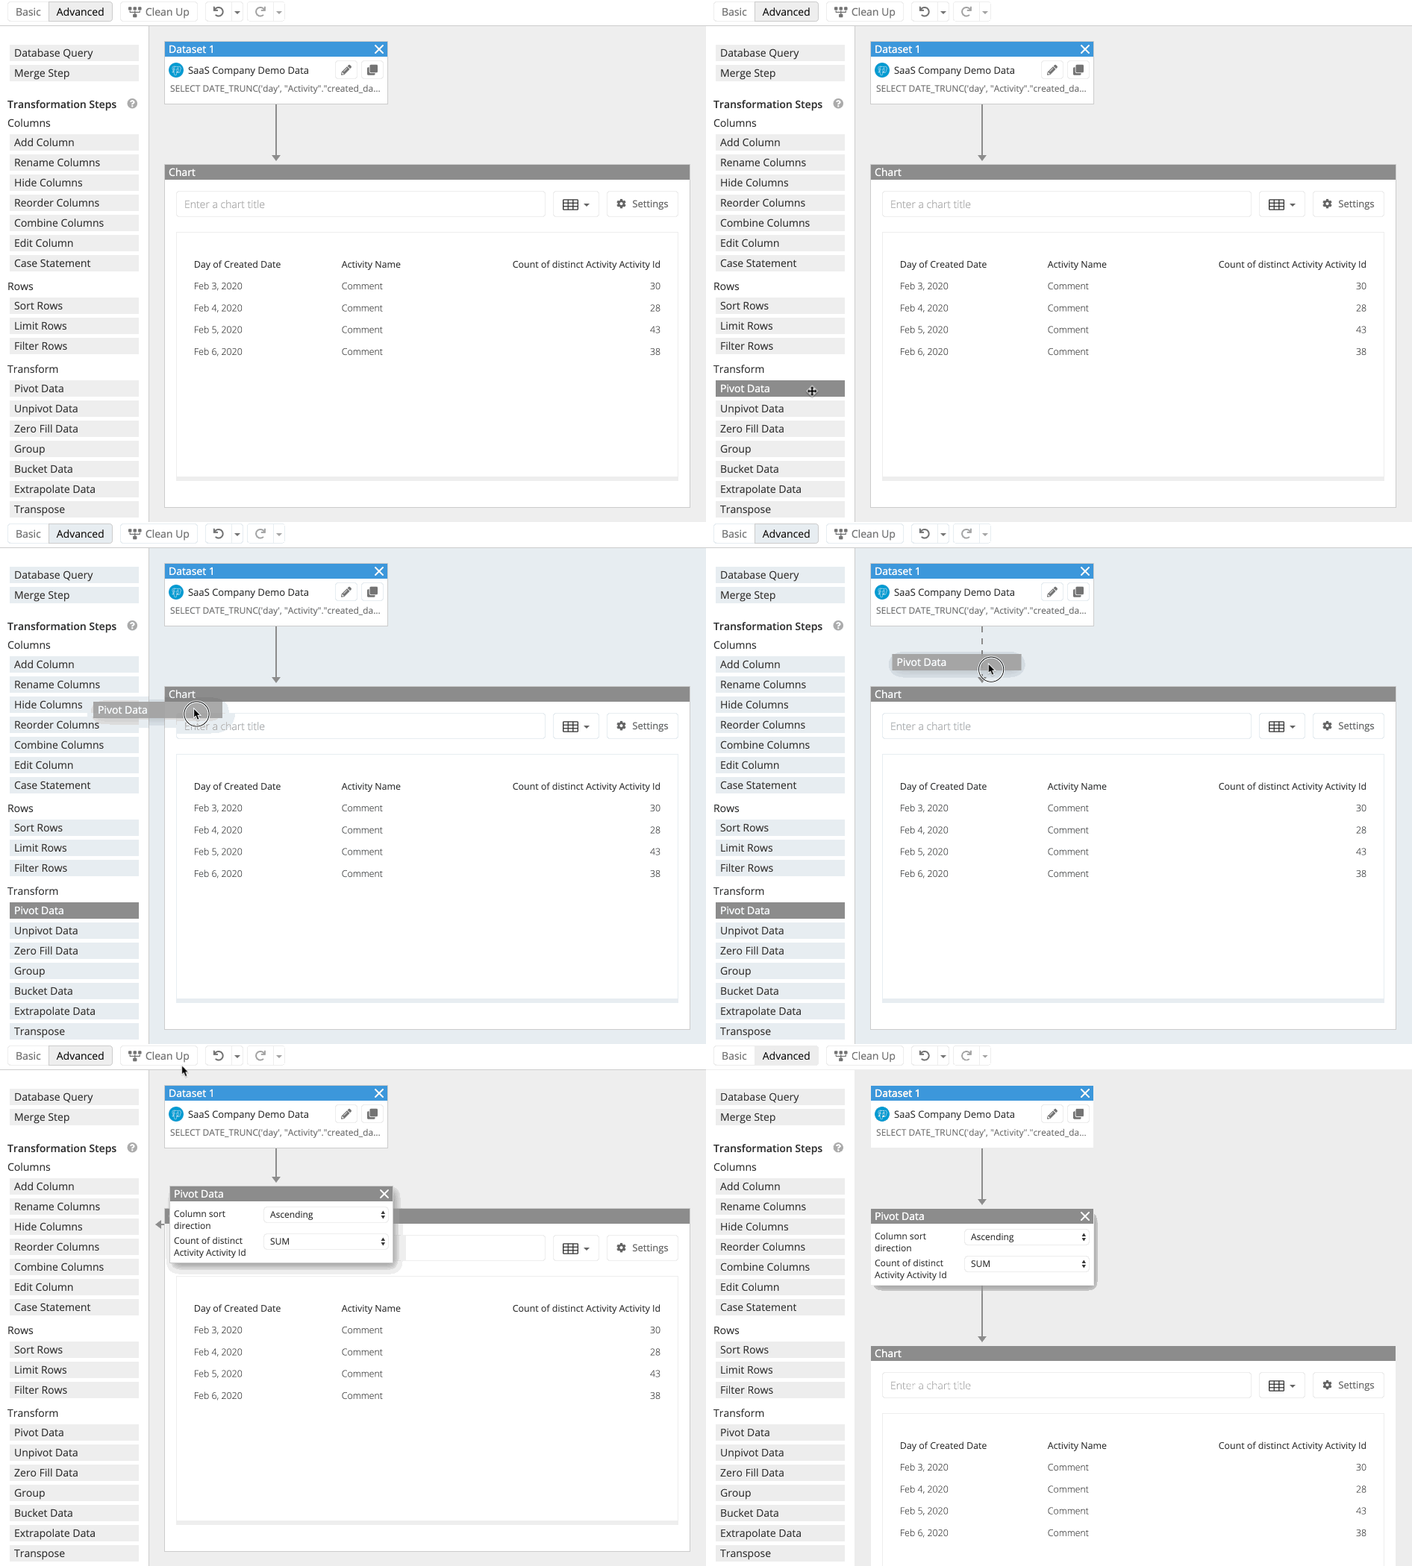
But maybe you want to manually connect nodes together–you can do that too. Let’s say you want the result of Node A to pass to Node B. To connect them, you’d do the following:
- Click the output square of Node A then hover anywhere on Node B.
- Node B will be highlighted in blue to show the connection is recognized. Nodes to which you can’t connect will be greyed out.
- Finally, click on Node B to complete the connection.
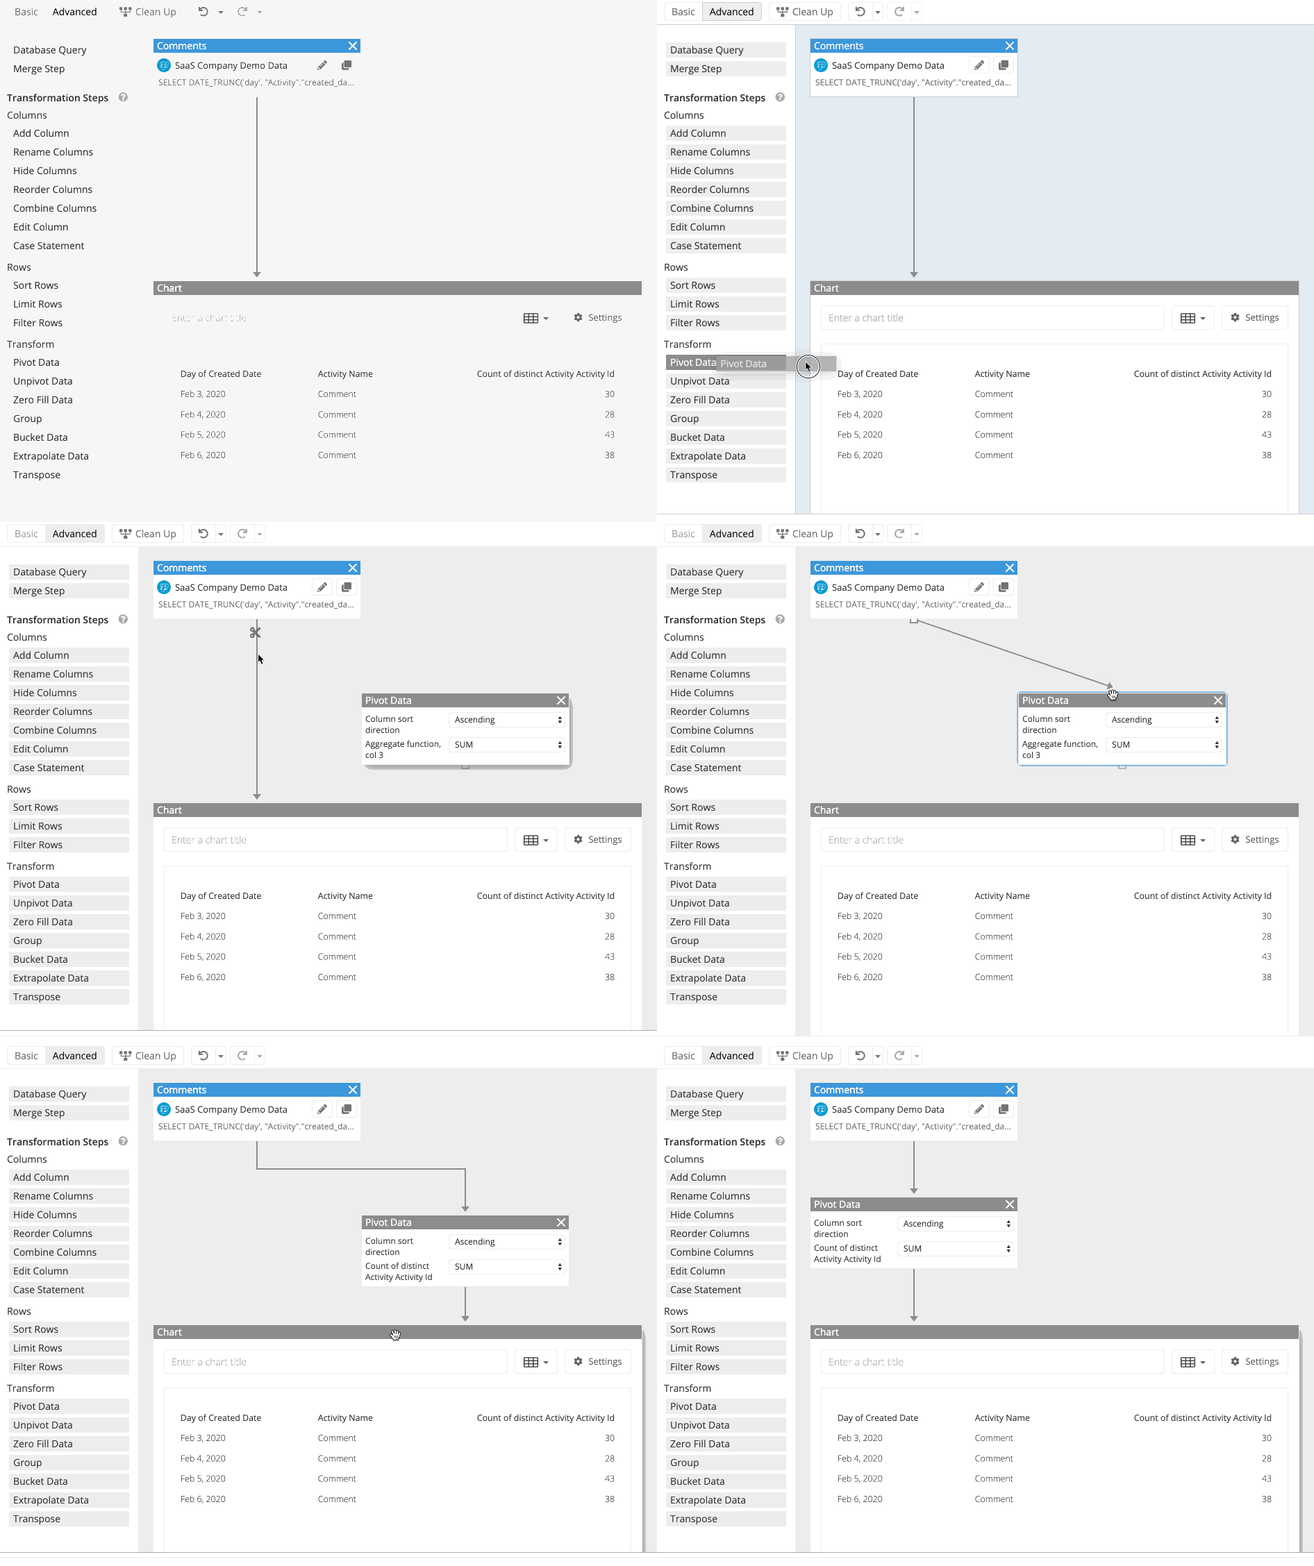
If a node’s output is already connected to another node, its connector square won’t be visible. You can only connect a node’s output to one other node at a time. However, a Merge Step node can accept multiple input connections.
Disconnect nodes
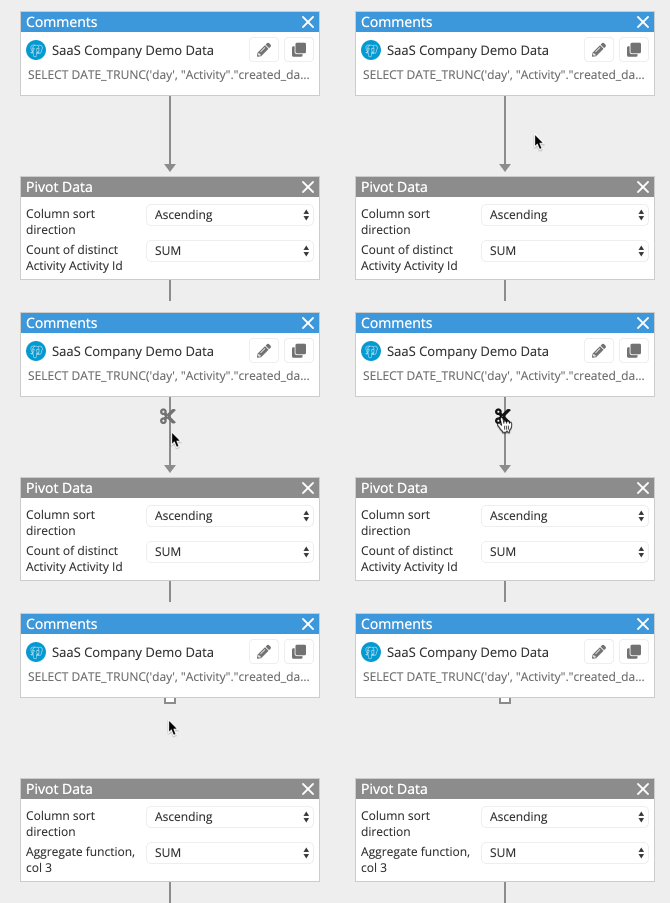
To disconnect two nodes, hover over the line connecting the nodes and click the Scissors that appear.
Tip! In Advanced Mode, you can have “floating” nodes (i.e., nodes not connected to other nodes). This is particularly useful if you need want to troubleshoot or test a different query or transformation step in your pipeline without removing the floating node altogether. The pipeline will still execute with floating nodes, but you won’t be able to switch back to Basic Mode until you reconcile them by either connecting or removing them from your pipeline.
Undo
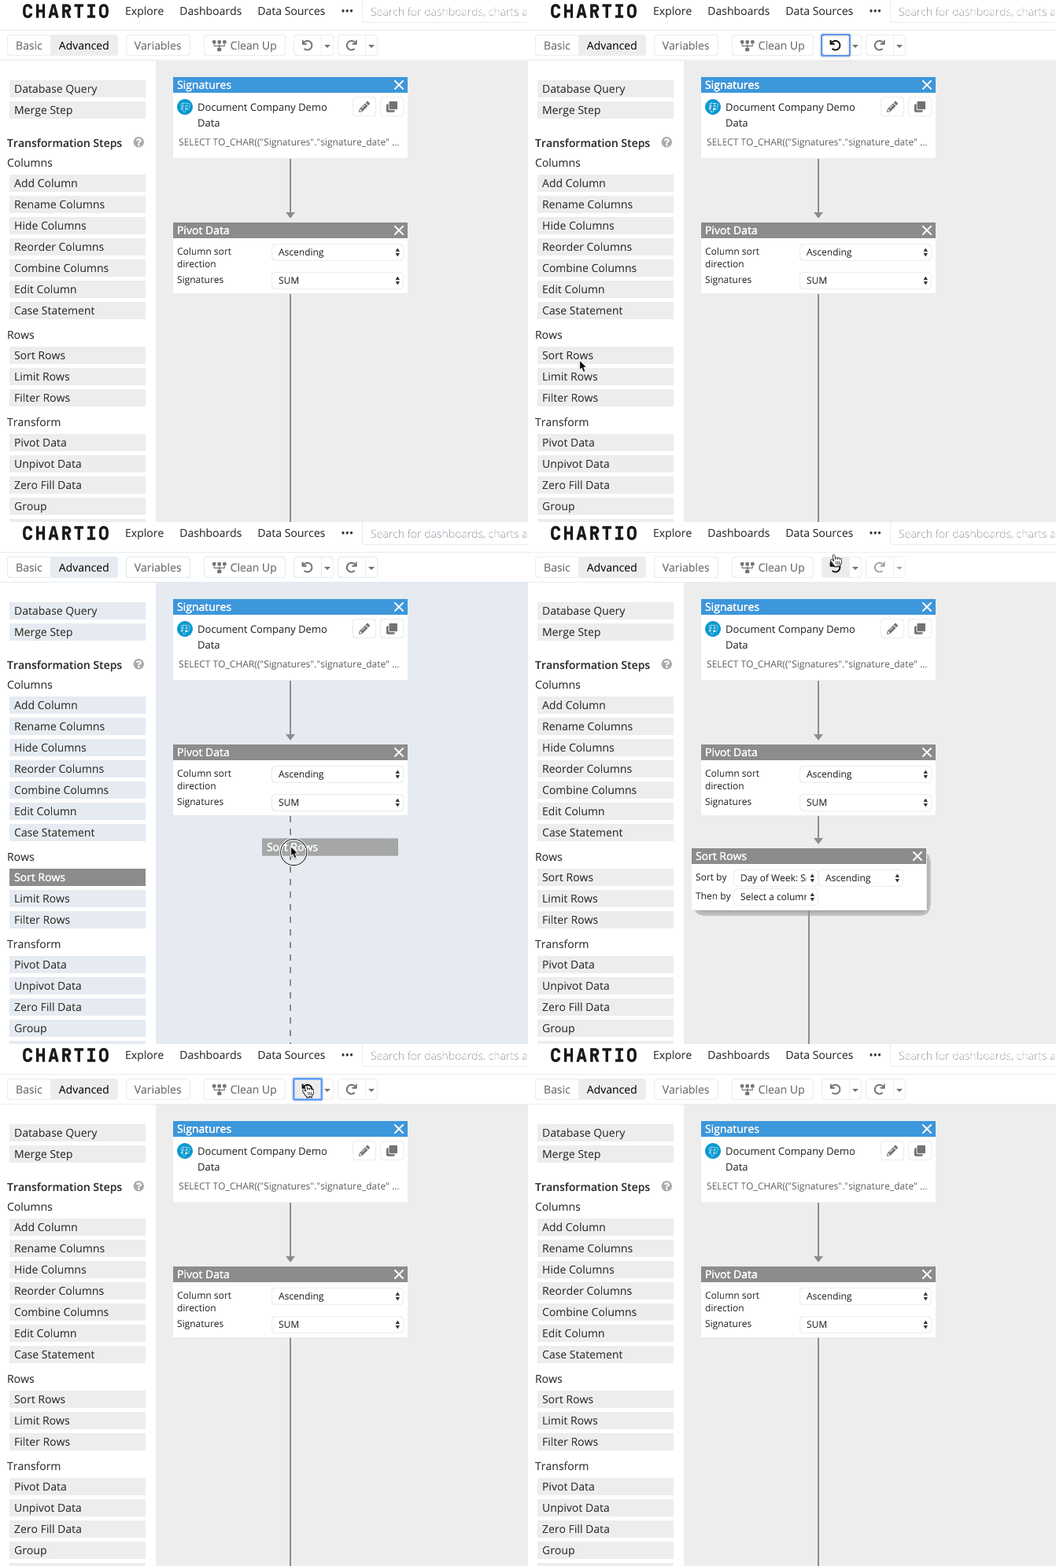
Advanced Mode offers users the option to undo actions taken such as adding Dataset queries, Pipeline steps, or making changes to your steps.
To undo your last action, simply click on the Undo button at the top of the page as shown below:
Undo multiple steps
You can also undo multiple actions taken at once. To do this, click on the arrow to the right of the undo button. This will open up a list of actions taken on this chart since the last time the chart was saved and closed.
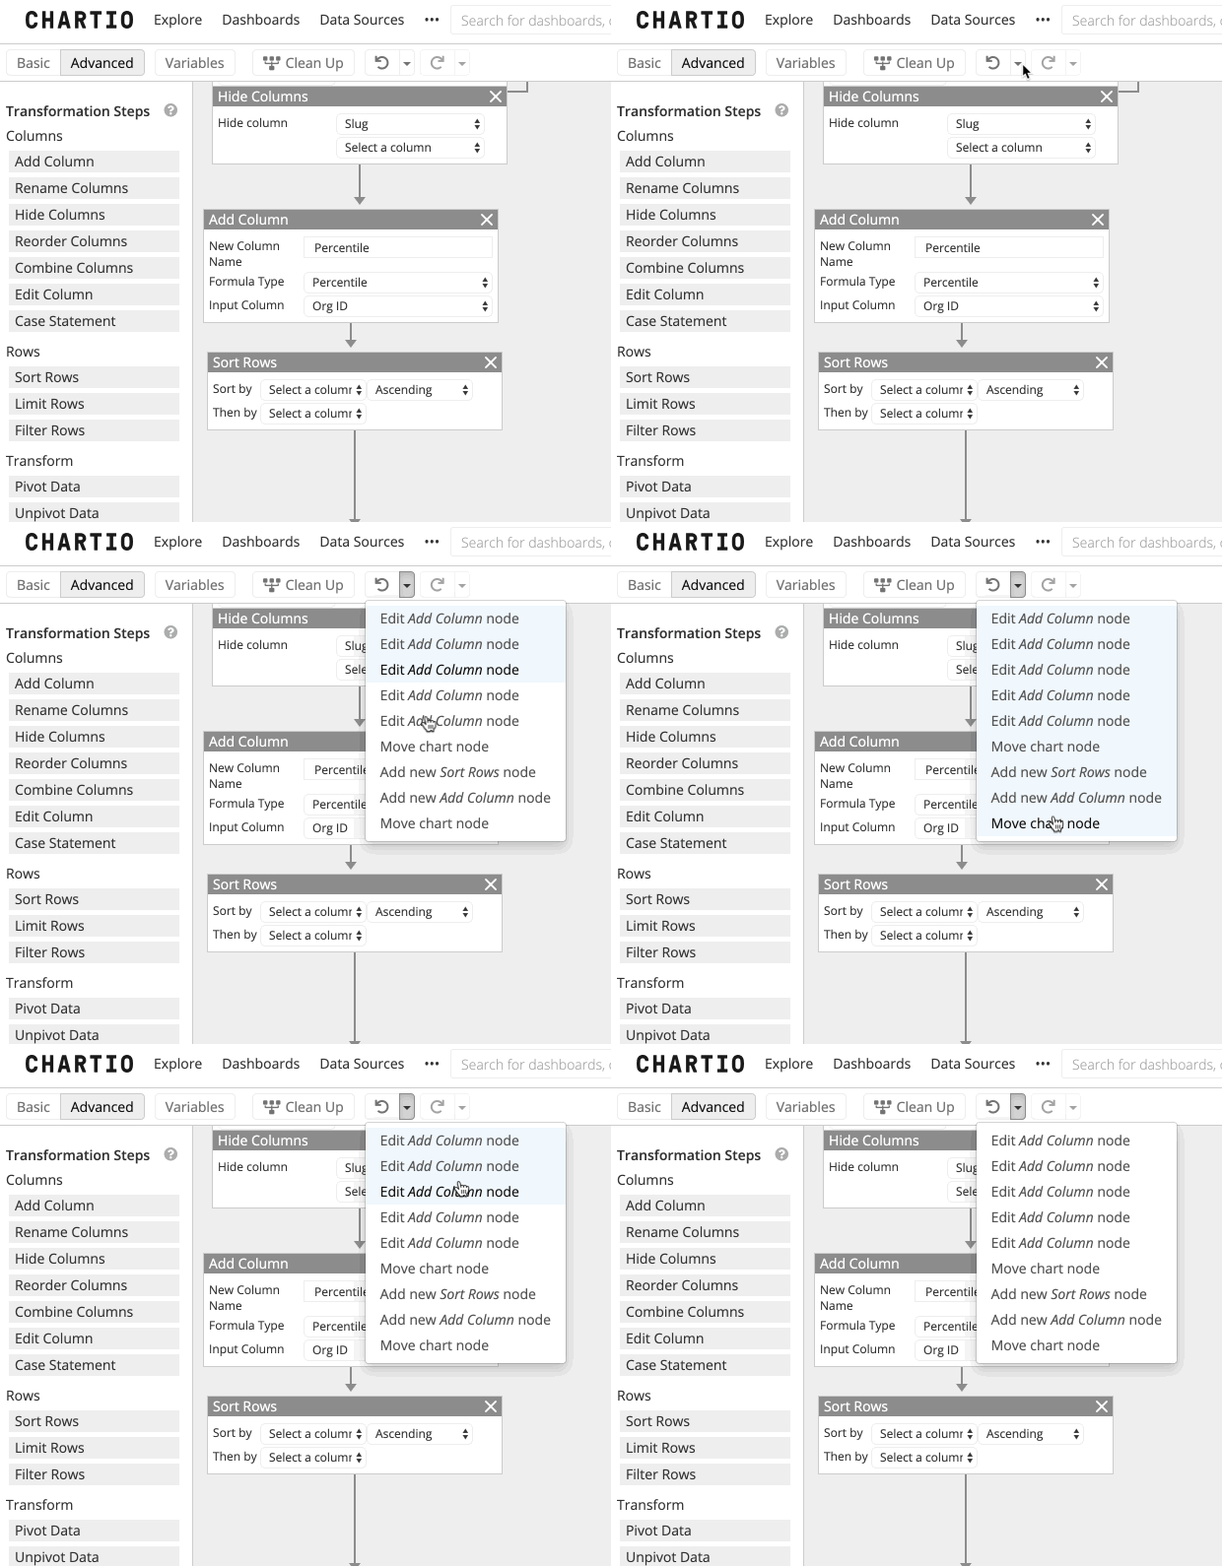
You then have the option of selecting the most recent action to undo (first option at the top of the list) to the first action you’ve taken (last option at the bottom of the list). The actions which will be reverted will be highlighted in blue. Simply click on the step up to which you’d like to undo and you’ll be taken to that previous state.
Redo
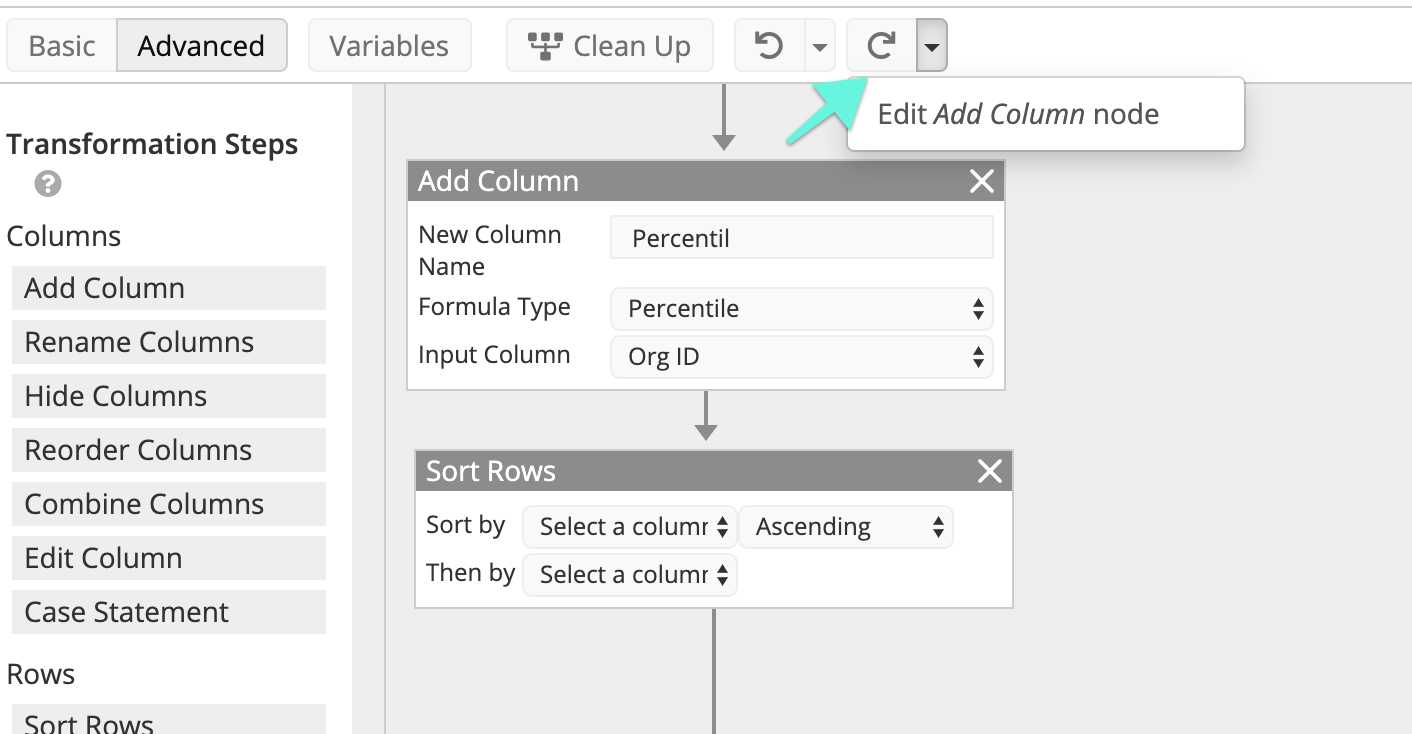
If you’ve undone some changes you realize you still need, click on the Redo button beside the Undo button to redo your changes to the previous state.
This button works similarly to the Undo button. If you’d like to redo multiple actions you’ve just undone, click on the arrow beside the Redo button to open the list of your recent “undone” actions and select up to which action you’d like to be redone in your chart.
Preview Data drawer
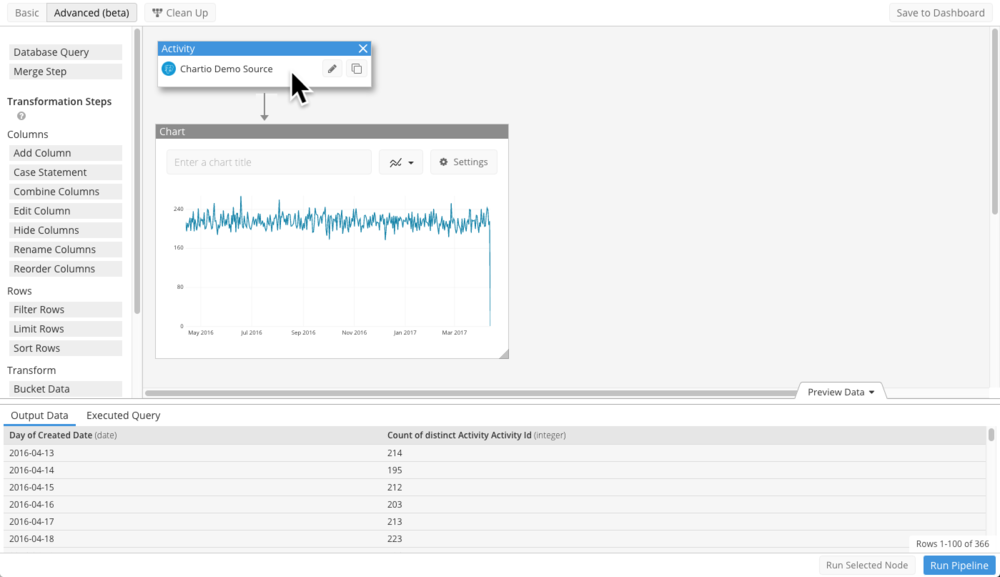
You can preview a specific node’s data by expanding the Preview Data drawer. To open the Preview Data drawer, click Preview Data at the bottom-right corner of the canvas. Whenever you click a node in your Pipeline, Preview Data will show the selected node’s data.
- For Database Query nodes, you can view the Output Data and the executed SQL query.
- For Merge Step nodes, you can only view the Output Data.
- For Transformation Step nodes, you can view the Input and Output data.
- For the Chart node, you can view the Chart Data, which is the final result set of your Pipeline.
Run Selected Node
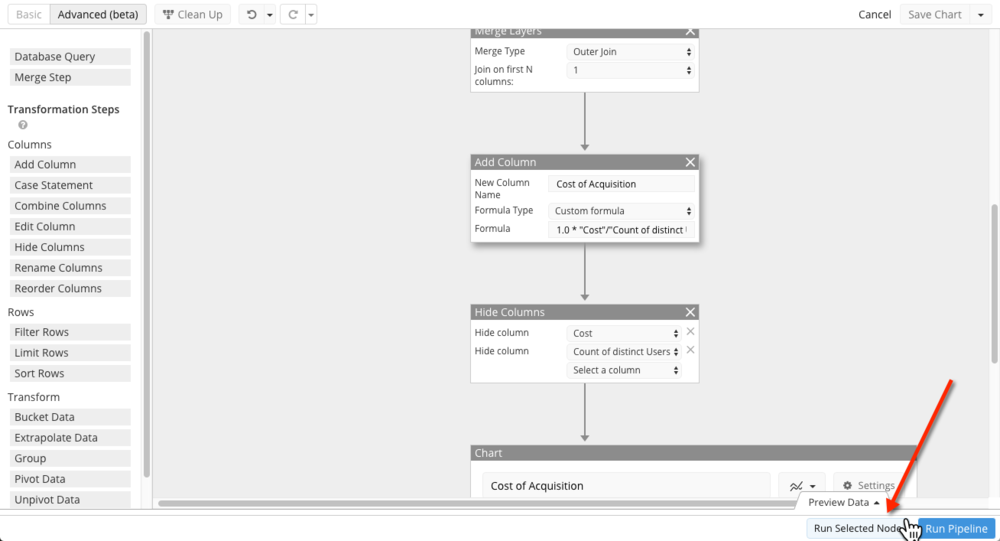
Whenenver you’re editing a node, you can click Run Selected Node, which appears next to the Run Pipeline button, to run the Pipeline up to that point and view its updated result set in the Preview Data drawer. This can be especially useful for testing and troubleshooting a part of your Pipeline separately.
Execute your Data Pipeline
To run your queries and update your entire Pipeline, click Run Pipeline at the bottom-right corner of the Data Explorer. Your Chart node will update with the new result set.
