Node Types
Nodes are modules you drag onto the canvas to build your chart. Types of nodes include Database Query, Transformation Step, and Merge Step.
Database Query node
Add a dataset to your chart by adding a Database Query node to your Pipeline. Database Query nodes are equivalent to datasets in the Basic Chart Editor.
Note: Datasets and charts in Advanced Mode follow the same row limits as any other charts. In Advanced Mode, you won’t receive the message indicating the row limit for the chart is hit like you would see in a Basic Mode chart.

Edit a Database Query node
To edit a Database Query node, click the Pencil on the node.

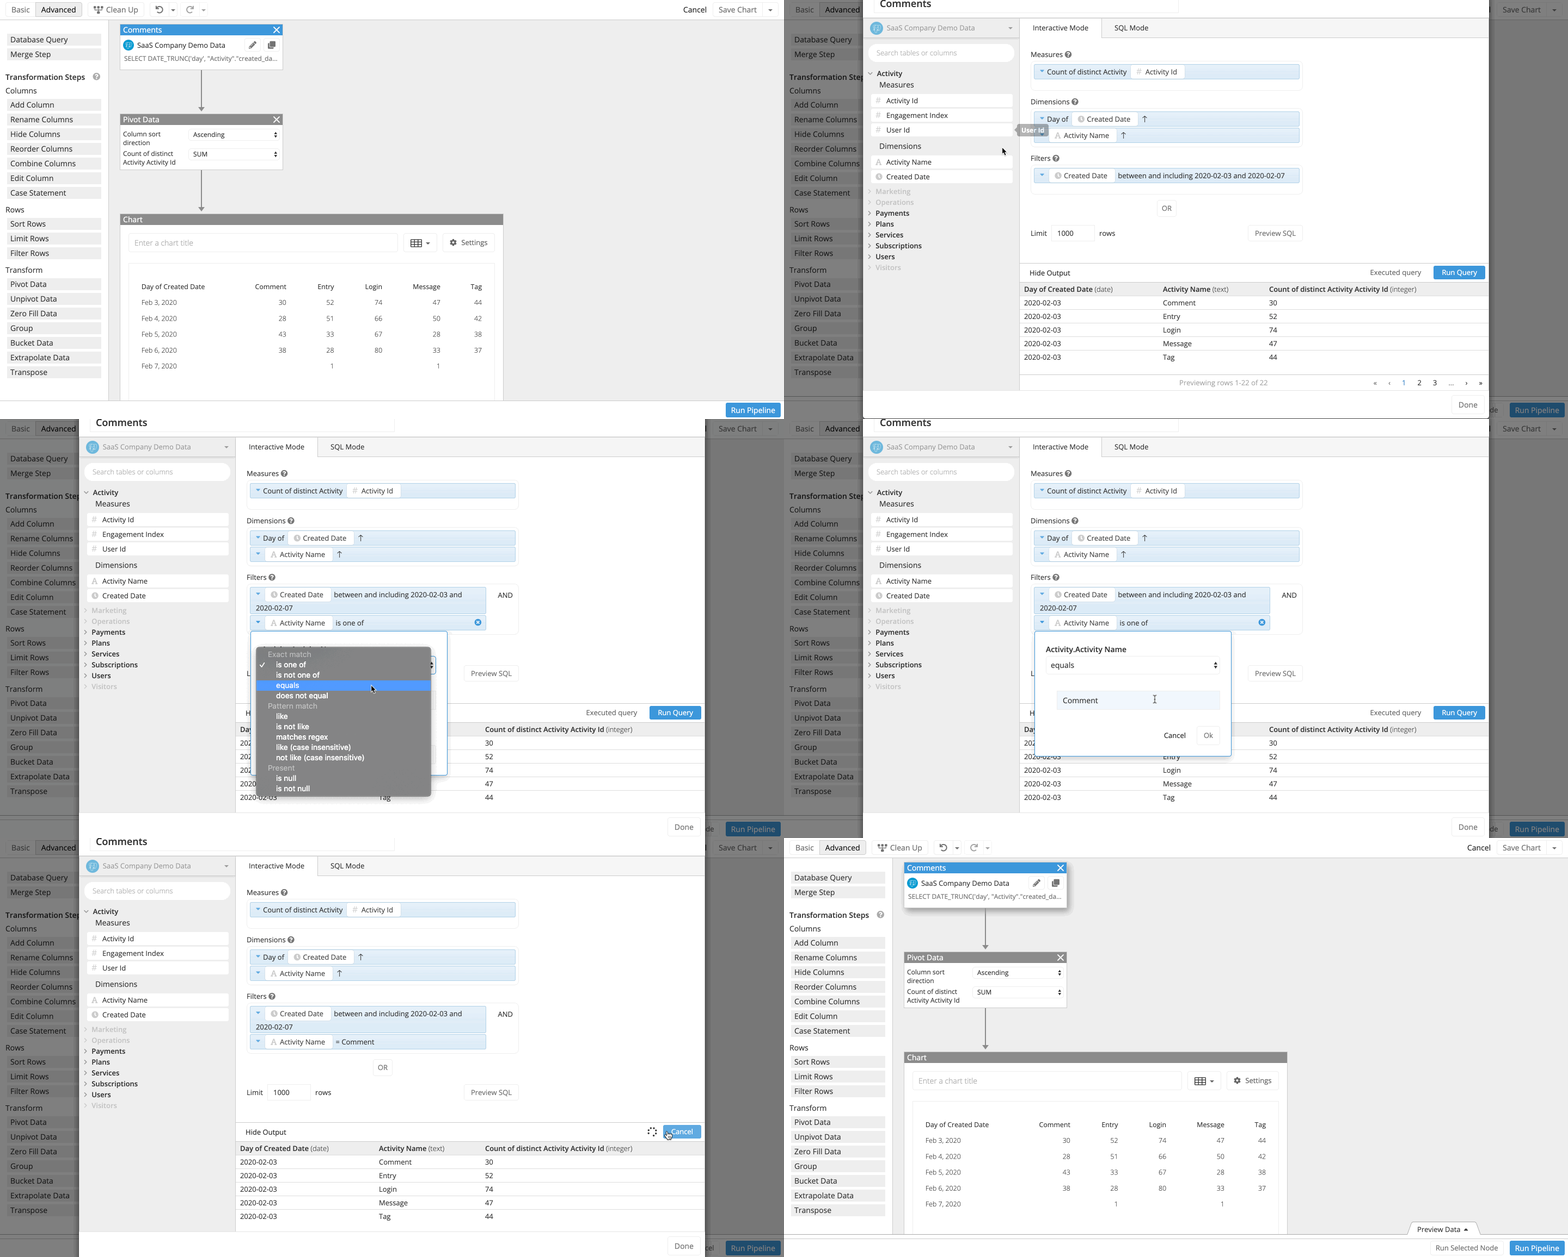
You’ll notice the Database Query node editor looks similar to what you’d see in the Basic Mode. Just like in the Basic Mode, you can use Interactive Mode or SQL Mode within your Database Query node to build your query.
Once your query is ready and run, click Done to save your changes and close the node editor. Alternatively, you can click outside the editor modal to save and close the editor.
Clone a Database Query node
Click the square clone icon at the top-right of the node to clone it.

The Database Query node editor will pop up, where you can rename the clone and modify the clone’s query before it’s placed onto the canvas. You can click Run Query to check the result set then click Done or click outside of editor modal to save your new query. To make them a bit easier for you, Query clones are automatically placed to the right of the rightmost Database Query node already on the canvas.
Transformation Step node
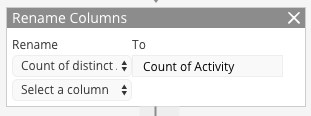
Transform a node’s data output by adding one of the many Transformation Step nodes onto the canvas. Transformation Step nodes are equivalent to Pipeline Steps in the Basic Chart Editor.
Merge Step node
Combine the results from two or more Database Query nodes by connecting their output to a Merge Step node. You can use as many Merge nodes as you wish.
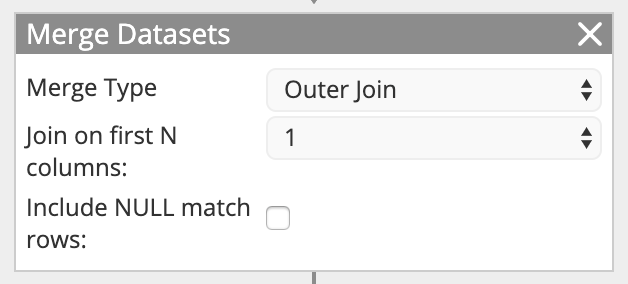
The Query node visually on the left is considered the left table for joins, and the Query node visually on the right is the right table.
Merging multiple Database Query nodes
Once you’re ready to merge the result sets of your Database Query nodes, add a Merge Step node to your canvas then connect each Database Query node’s output connector to the Merge Step node.
If you need help deciding which merge type to use, check out our quick descriptions of the different joins.
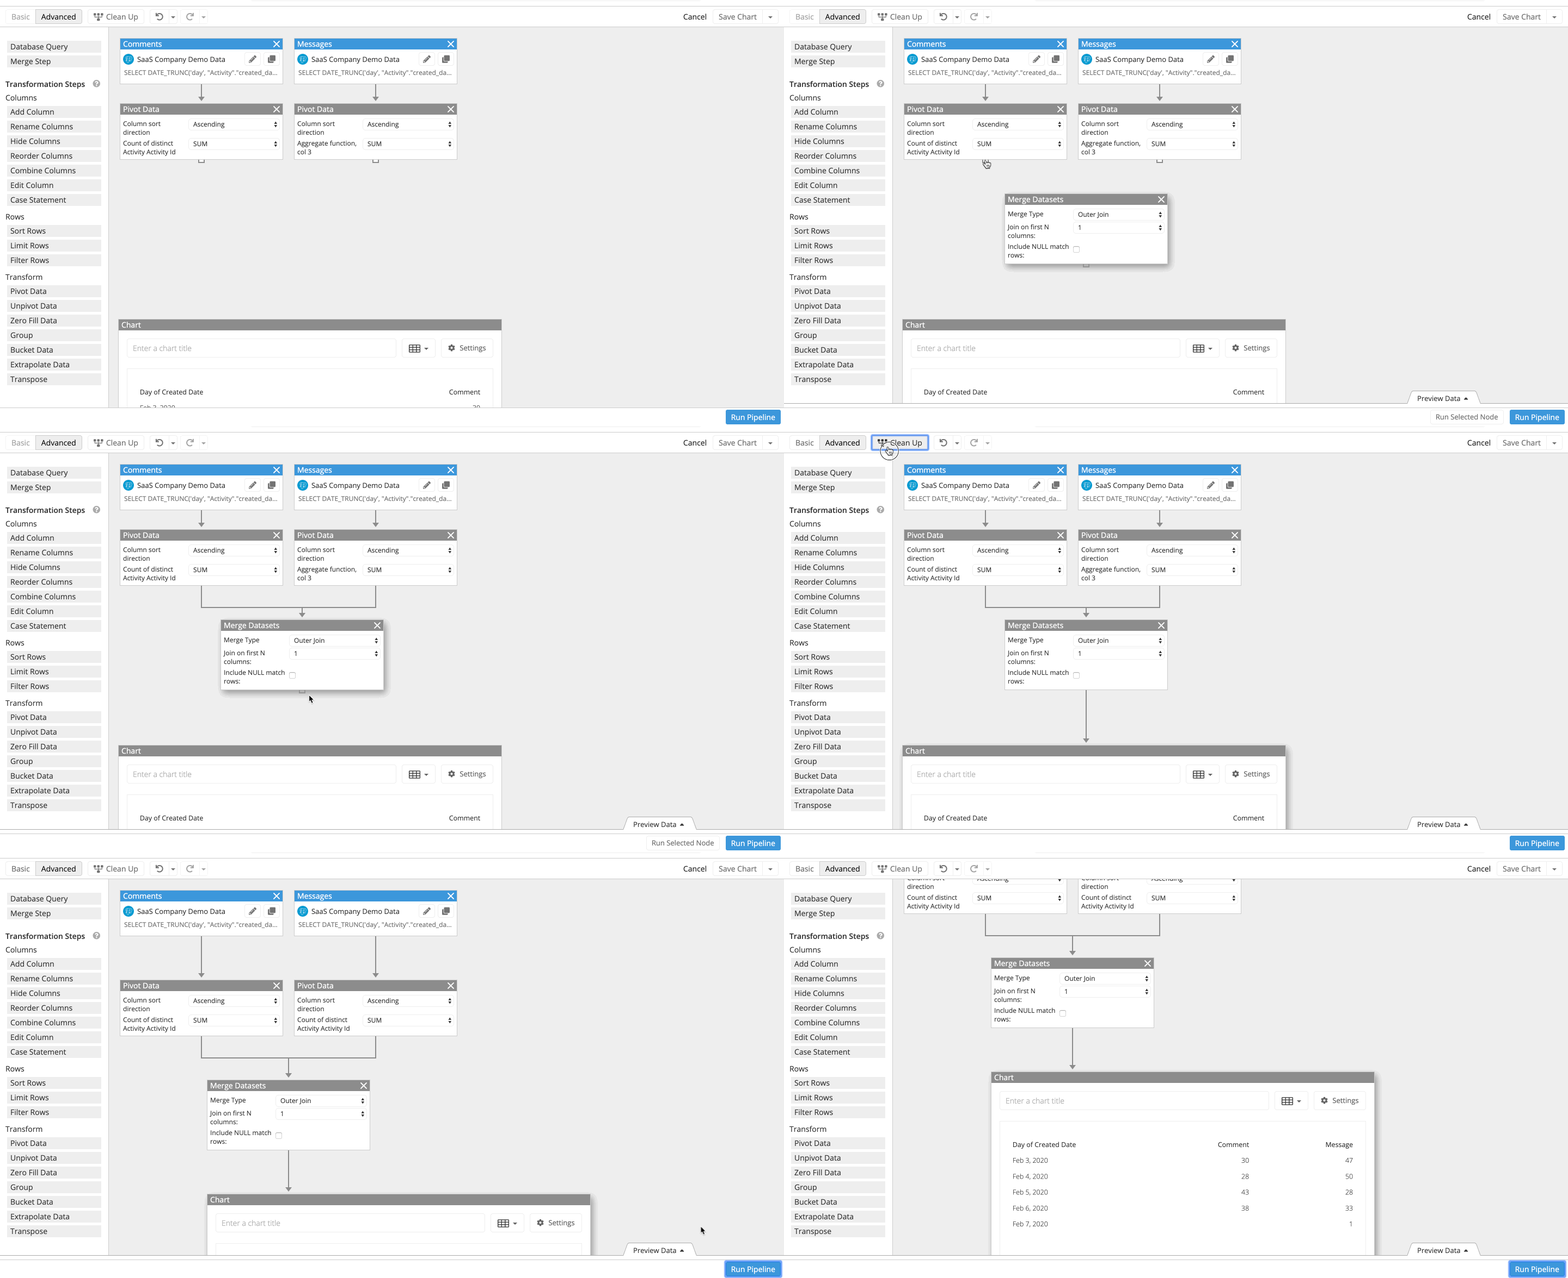
Chart node
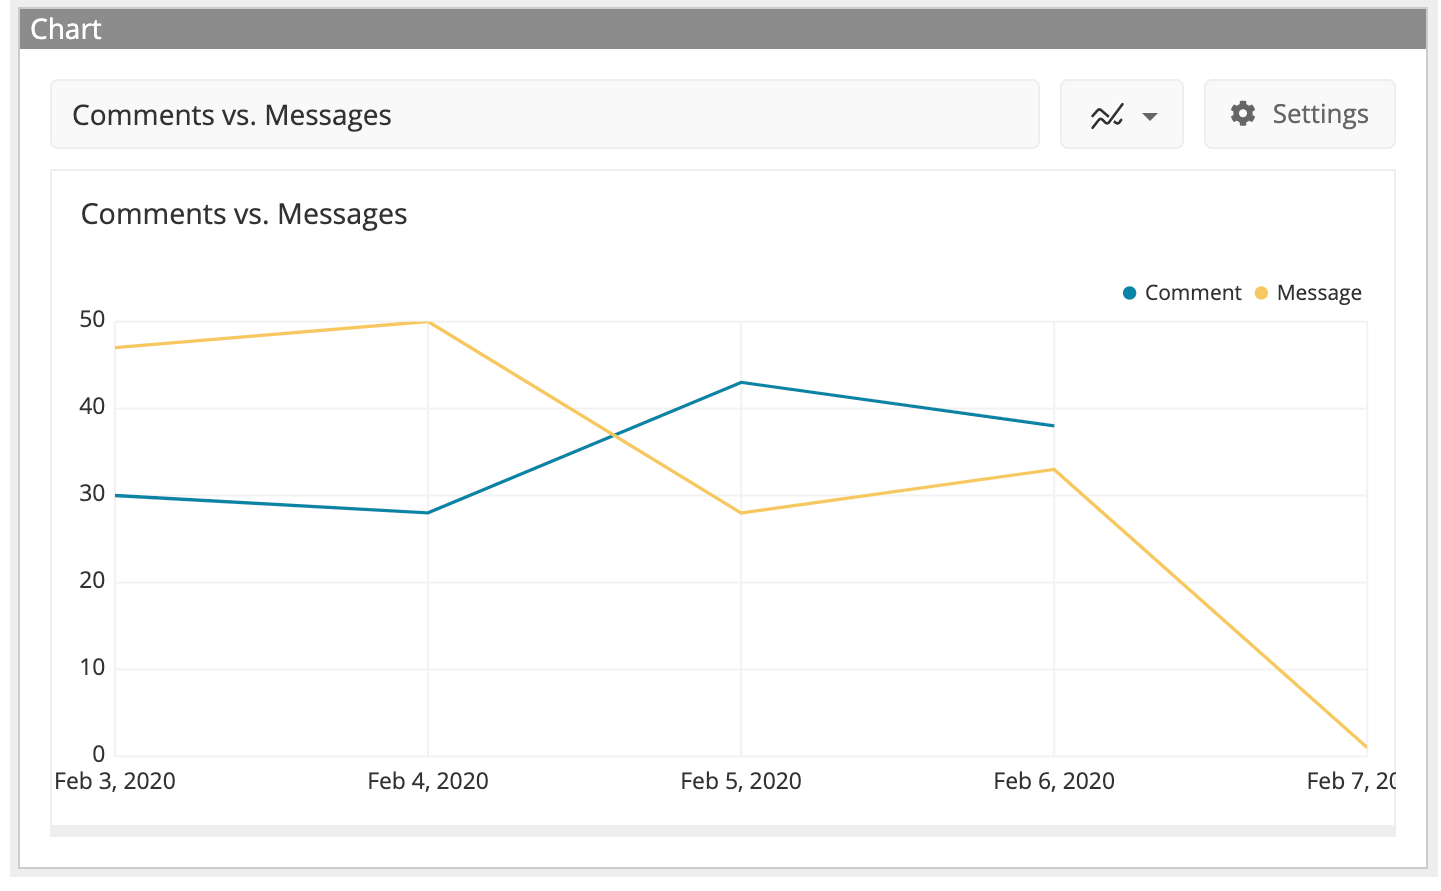
This node shows the resulting chart of your Pipeline. You can only have one Chart node in your Pipeline, and it’s already placed on the canvas for you.
Always make sure the Chart node is the last executed node in your Pipeline.
From the Chart node, you can modify your chart just as you would in Basic Mode:
- Enter a chart title
- Choose a different chart type
- Edit the Chart Settings
