Bubble Map Chart Settings (Vega)
If you joined before November 17, 2020, and are using our legacy chart library, refer to our legacy chart settings for more relevant info.
Available chart settings tabs for Bubble Map charts
| General | Color | Series | Drilldown |
General
“Chart title”, “Title font size”, “Chart subtitle”, “Subtitle font size”, and “Show tooltips” can be found in the General section of our Chart Settings page.
- Map type
- Choose the type of map for your Bubble Map chart
- Automatic: default; infers the best map to use based on your data
- World continents
- United States (State)
- United States (County)
- United Kingdom (County)
- France (Departments)
- North America
- South America
- Europe
- Asia
- Africa
Color
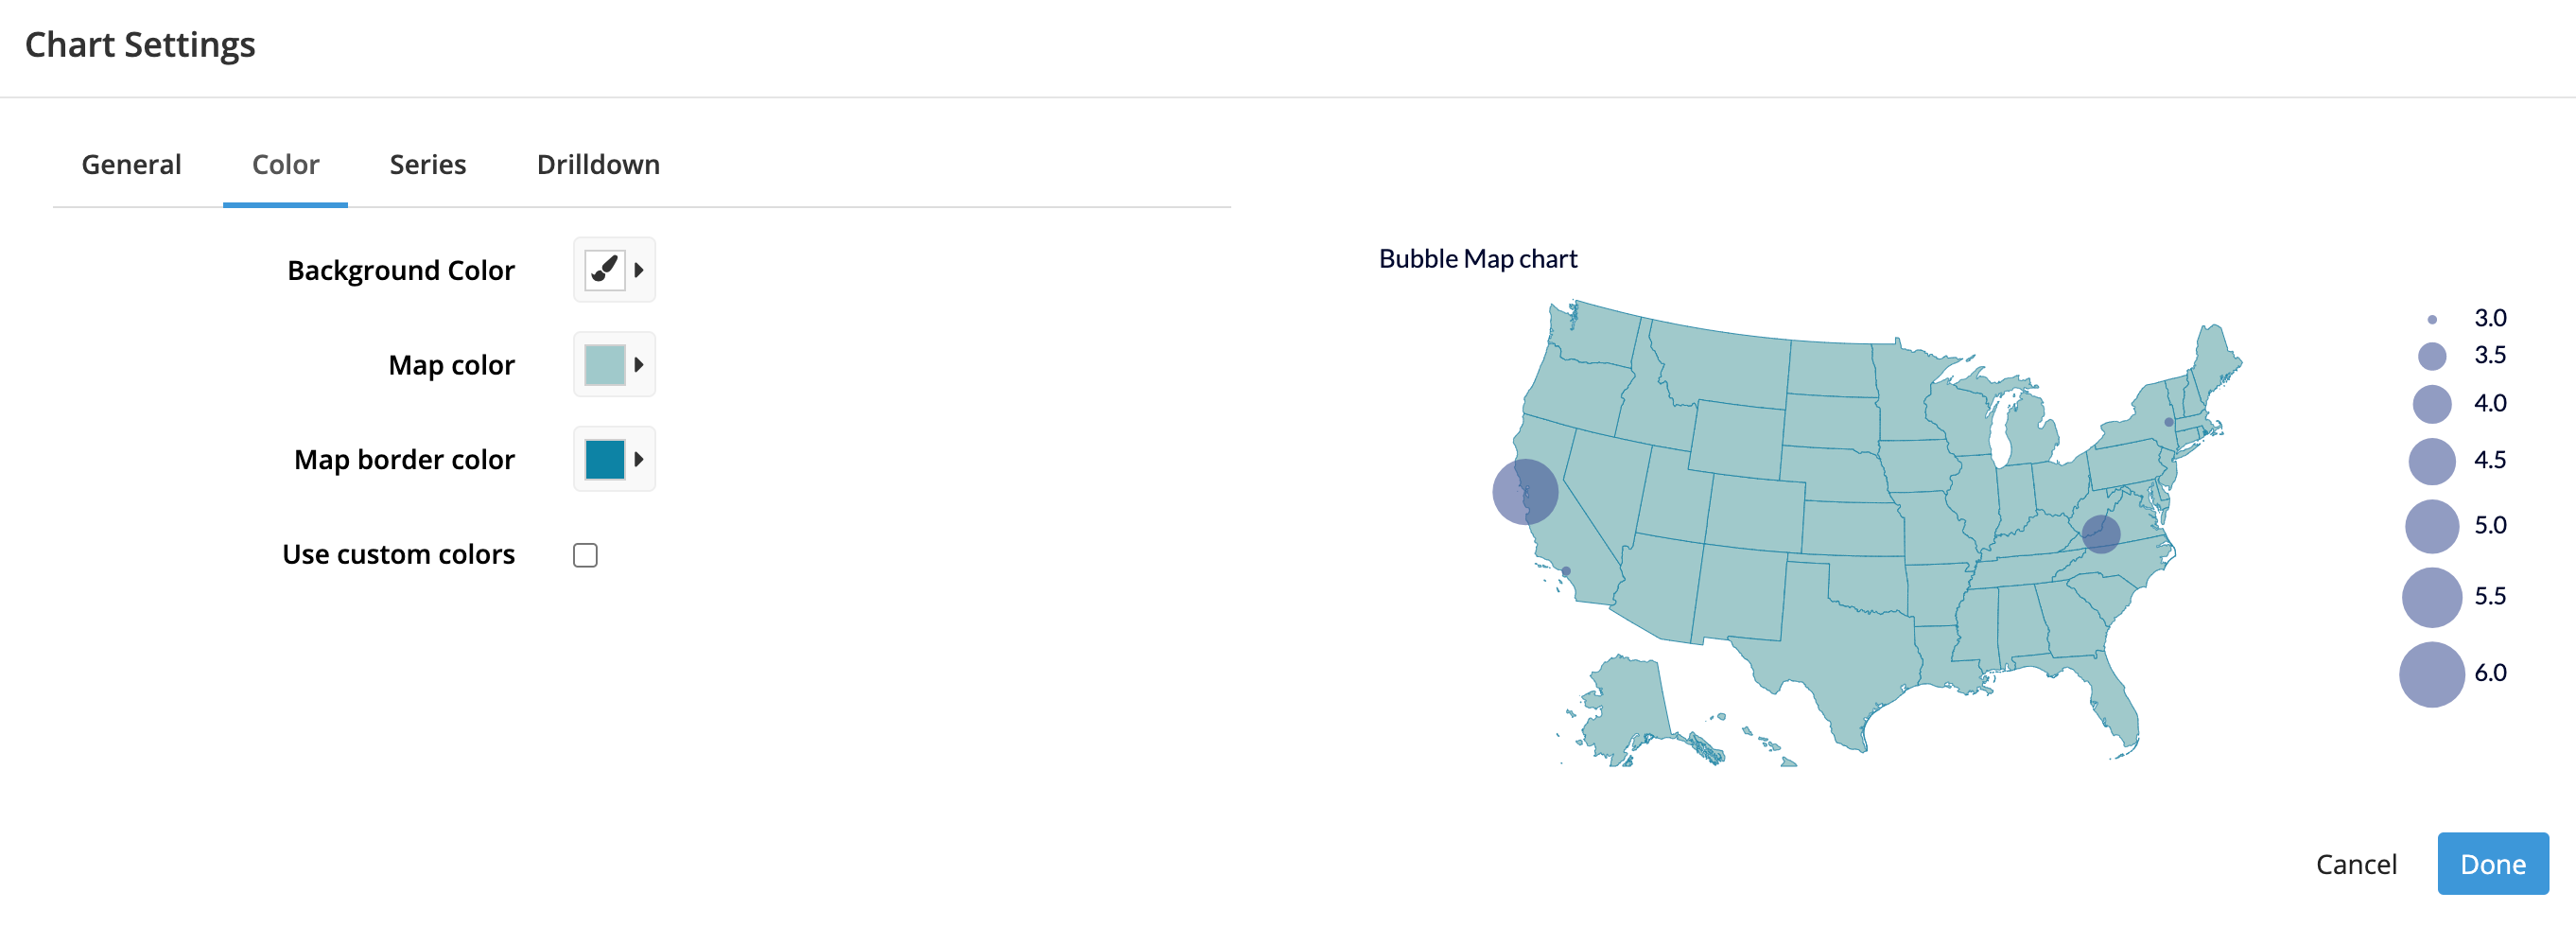
“Background color” and “Use custom colors” can be found in the Color section of our Chart Settings page.
- Map color
- Select the color of the map
- Map border color
- Select the color of your border lines

Series
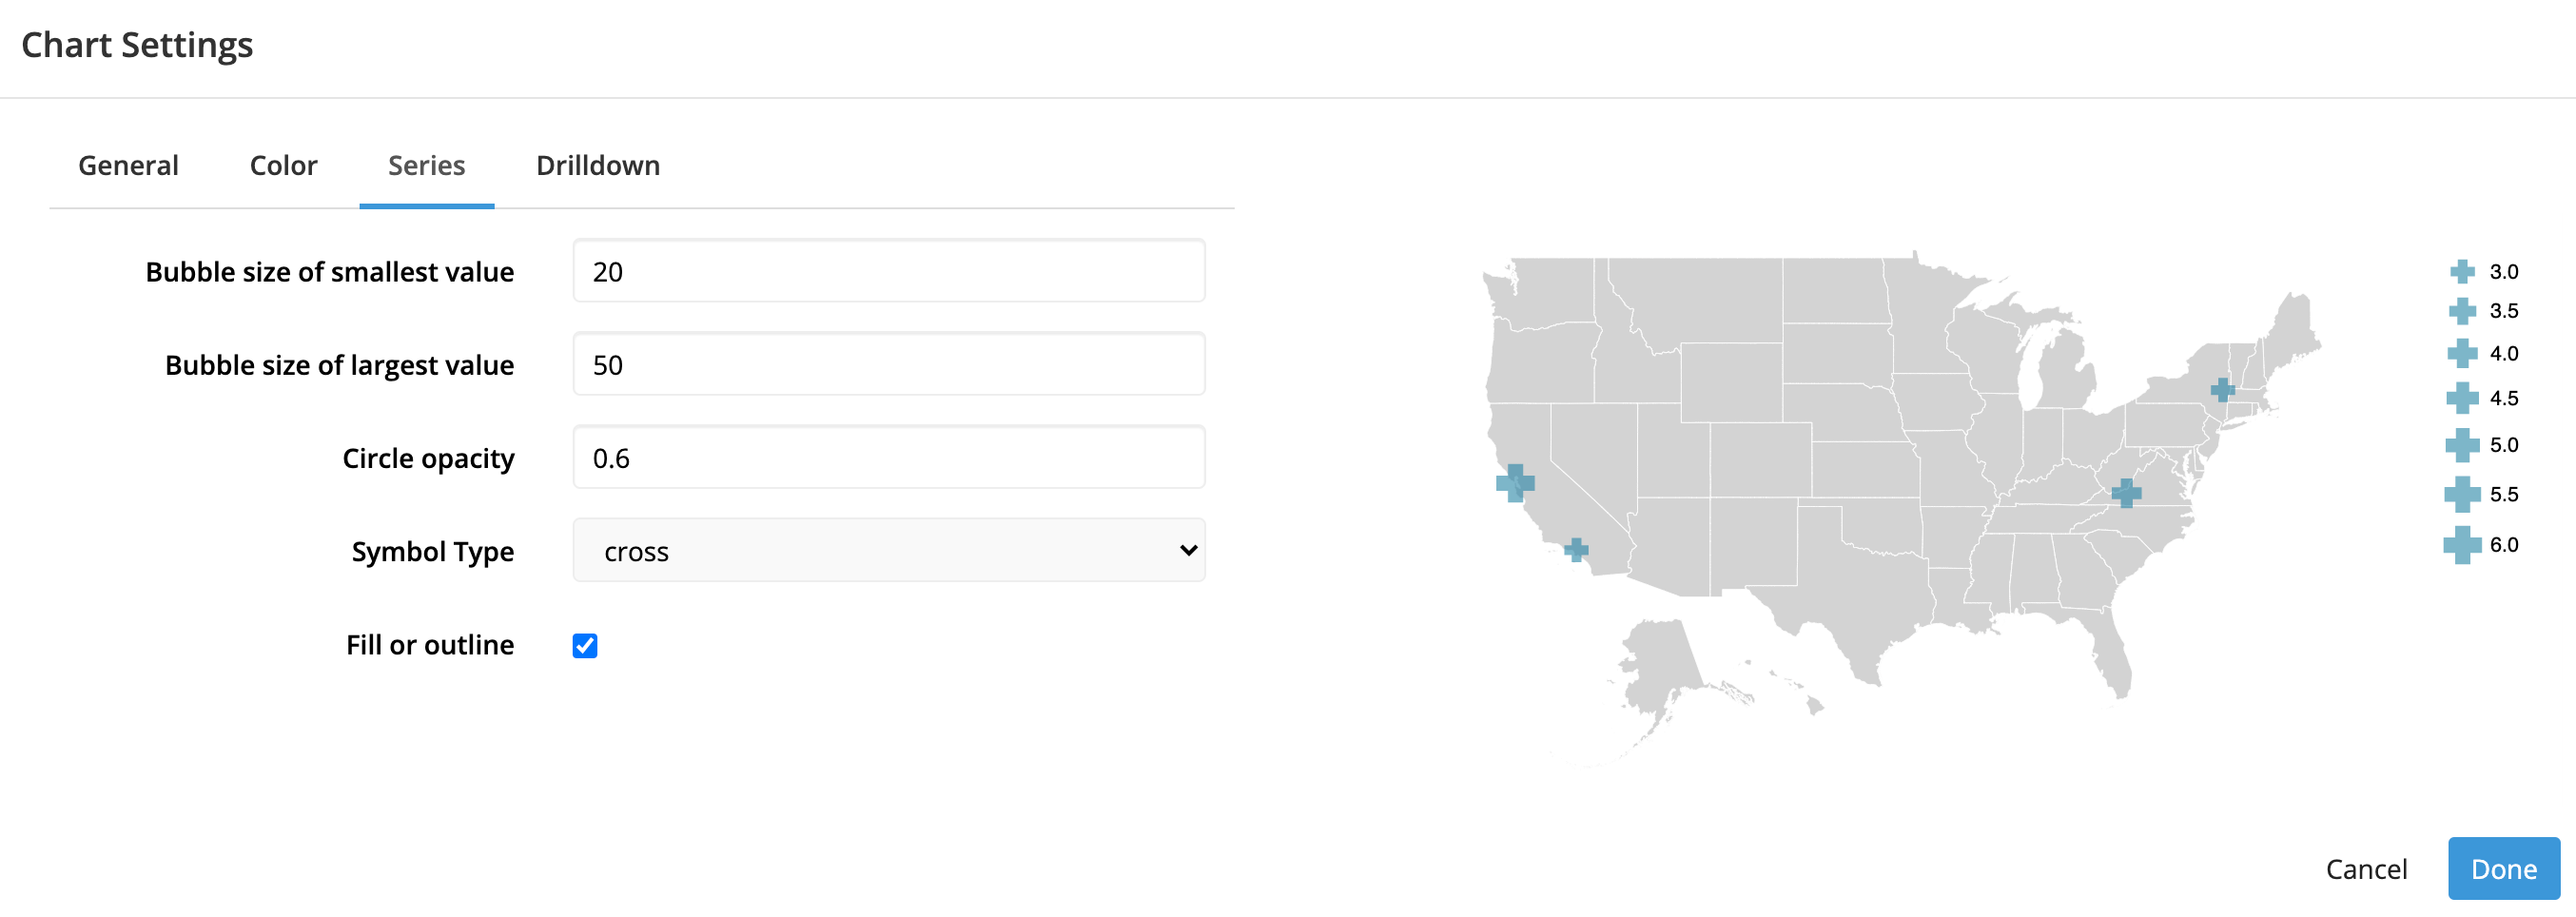
- Bubble size of smallest value
- Specify the minimum size of bubbles; max value is 50
- Bubble size of largest value
- Specify the maximum size of bubbles; max value is 50
- Circle opacity
- The bubble opacity; decimal value from 0 to 1, where 1 is the most opaque
- Symbol type
- Change the shape of the bubbles
- Circle (default)
- Square
- Cross
- Diamond
- Triangle-up
- Triangle-down
- Triangle-left
- Triangle-right
- Fill or outline
- Select to fill the bubbles

Drilldown
Check out Drilldowns for more information on this tab.