Range Input
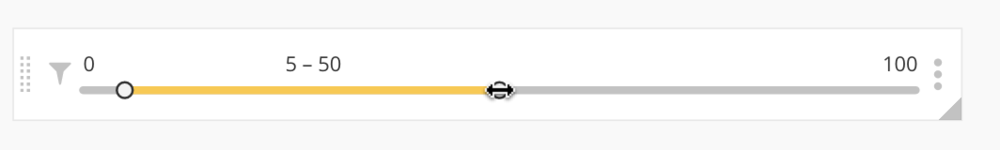
Range Inputs allow you to filter your data based on a selected numeric range.
Create a Range Input
Click Add Control from the dashboard sidebar menu and select Range Input. A modal will pop up for you to customize your Control settings.
Choose the Min and Max for your range, edit Precision if you’d like to include decimal values, and set the Default values that will be selected when the dashboard is first loaded.

Connect a Range Input to a chart
In the Visual SQL interface
Open the chart you’d like to connect to your Range Input in Visual SQL. Add the numeric column you want to filter your result set on to the Filters section, select between and including for the filter type, then select {RANGE_INPUT_NAME.START} and {RANGE_INPUT_NAME.END} for the beginning and end of the range, respectively. Replace RANGE_INPUT_NAME with your Control name.
Note: You’ll need to use the same .START and .END syntax when referencing Range Inputs in SQL Mode queries.
In the Data Explorer interface
Open the chart you’d like to connect to your Range Input in the Data Explorer. Drag the numeric column you want to filter your dataset on into the Filters section, select between and including for the filter type, then select {RANGE_INPUT_NAME.START} and {RANGE_INPUT_NAME.END} from the second and third dropdowns.
Note: You’ll need to use the same .START and .END syntax when referencing Range Inputs in SQL Mode queries.
