Embedding in Confluence
You can now embed Chartio dashboards into Atlassian Confluence! Unlike the typical Embedding functionality, which doesn’t require viewers to have a Chartio license, each user viewing the embedded dashboard in Confluence must have Chartio access. The Chartio dashboard is embedded as an IFrame that you can add to a Confluence page.
To get started, you’ll need:
- Chartio access
- Chartio Interactive Embedding enabled
- Confluence access
Step 1 - Create your Chartio dashboard
In Chartio, create the dashboard you plan to embed. You can add Dashboard Controls to your embedded dashboard to enable users to filter the data. You can also use the Current User Variable to customize the viewing experience of each user.
Note: Viewers must be logged into Chartio to view any embedded dashboards; otherwise, they’ll receive the “Not Logged In” error message.
Step 2 - Embed your dashboard in Confluence
-
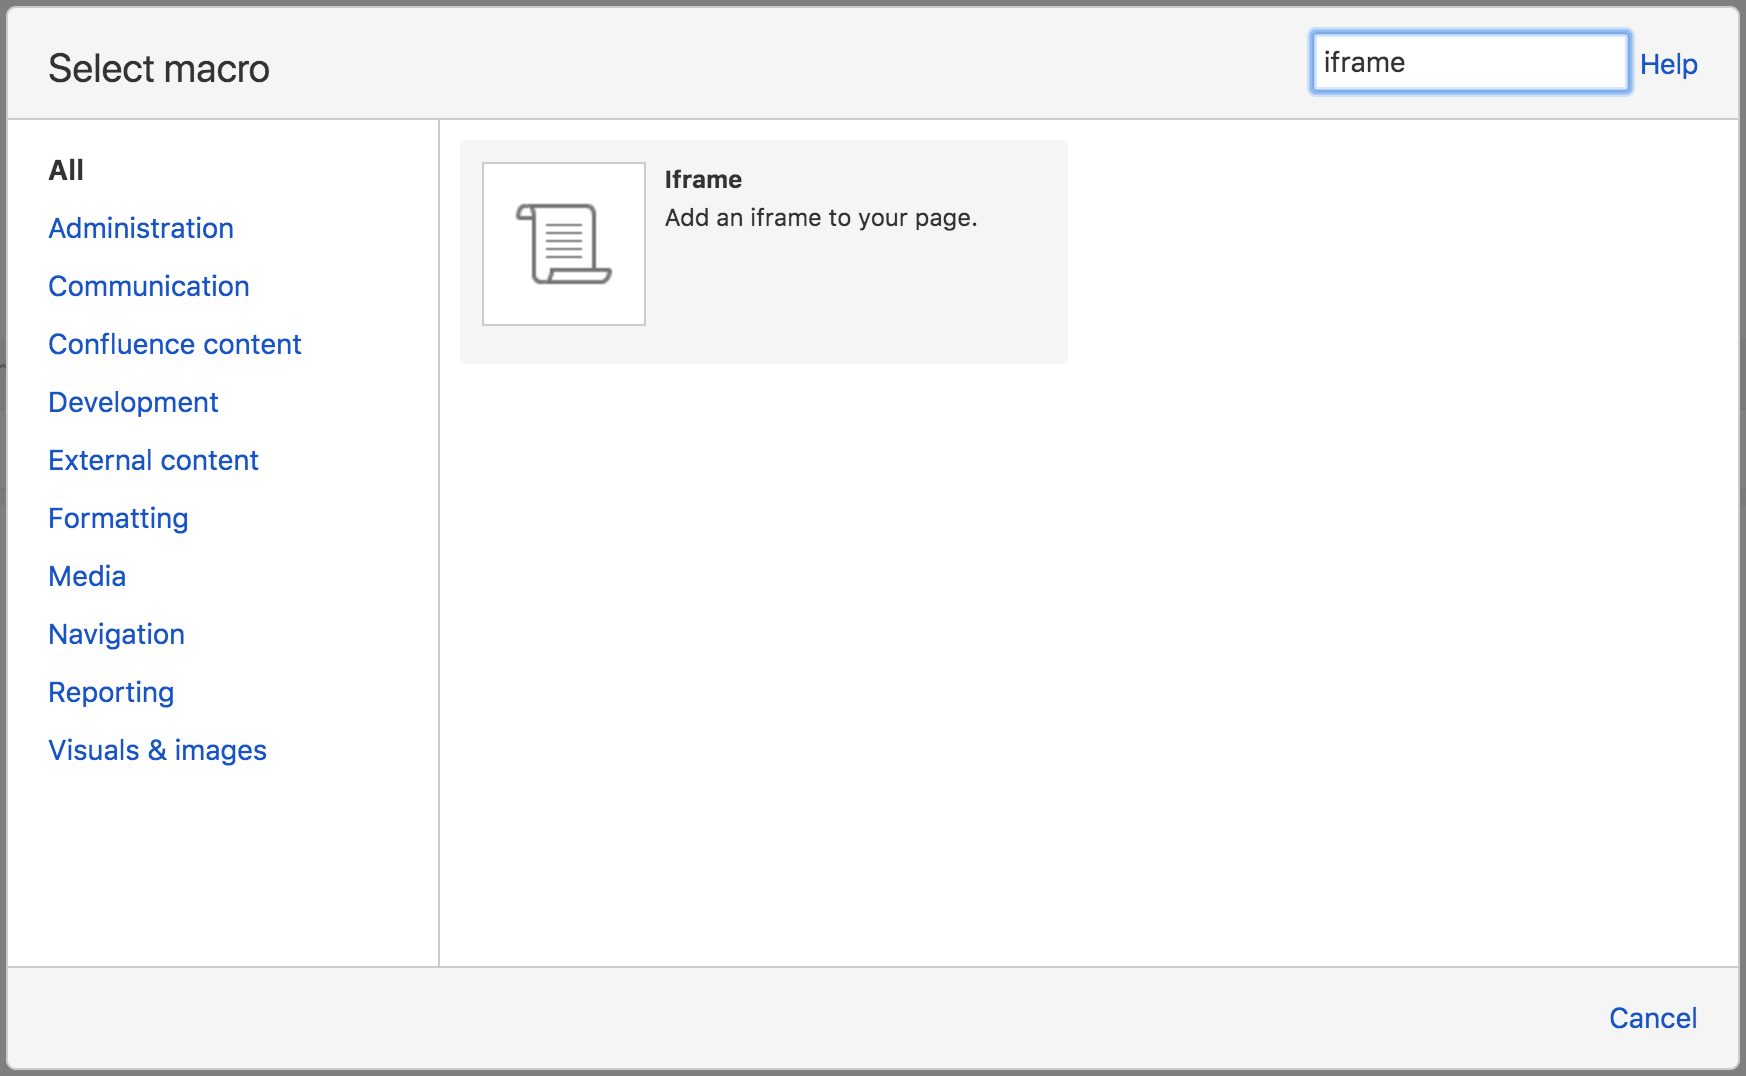
In Confluence, navigate to the page you want to add the dashboard to and open the “Edit” view. Insert an IFrame macro onto your page by going to Insert > View More > Iframe.
-
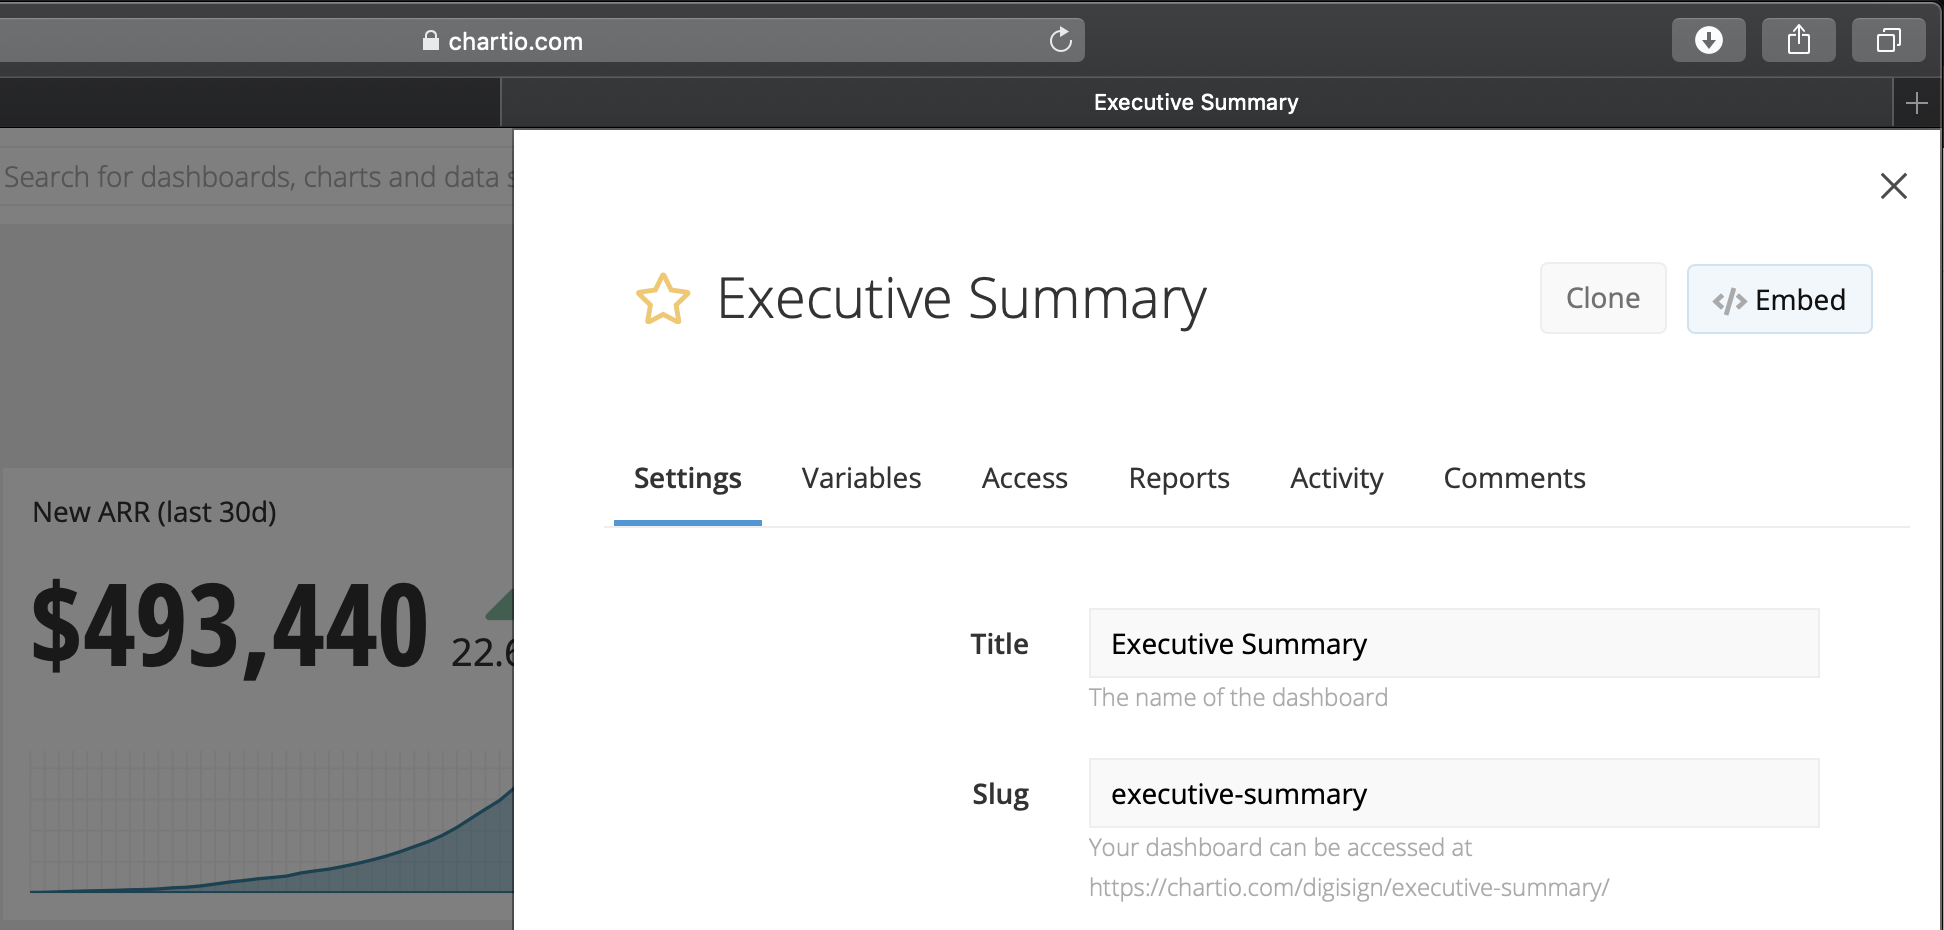
To add your Chartio dashboard to the IFrame, you can paste in the following for your URL, adjusting it so it contains your org slug and dashboard slug (make sure to remove the curly braces!):
https://chartio.com/d/{your-org-slug}/{your-dashboard-slug}/?embed=1Include any Dashboard Controls after
?embed=1to filter the query, where each Control is separated by an&. For example, if we wanted the PLAN Dropdown to showPremiumby default in our embedded dashboard, we’d include our PLAN Dropdown in the URL like this:https://chartio.com/d/my-org/my-dash/?embed=1&PLAN=Premium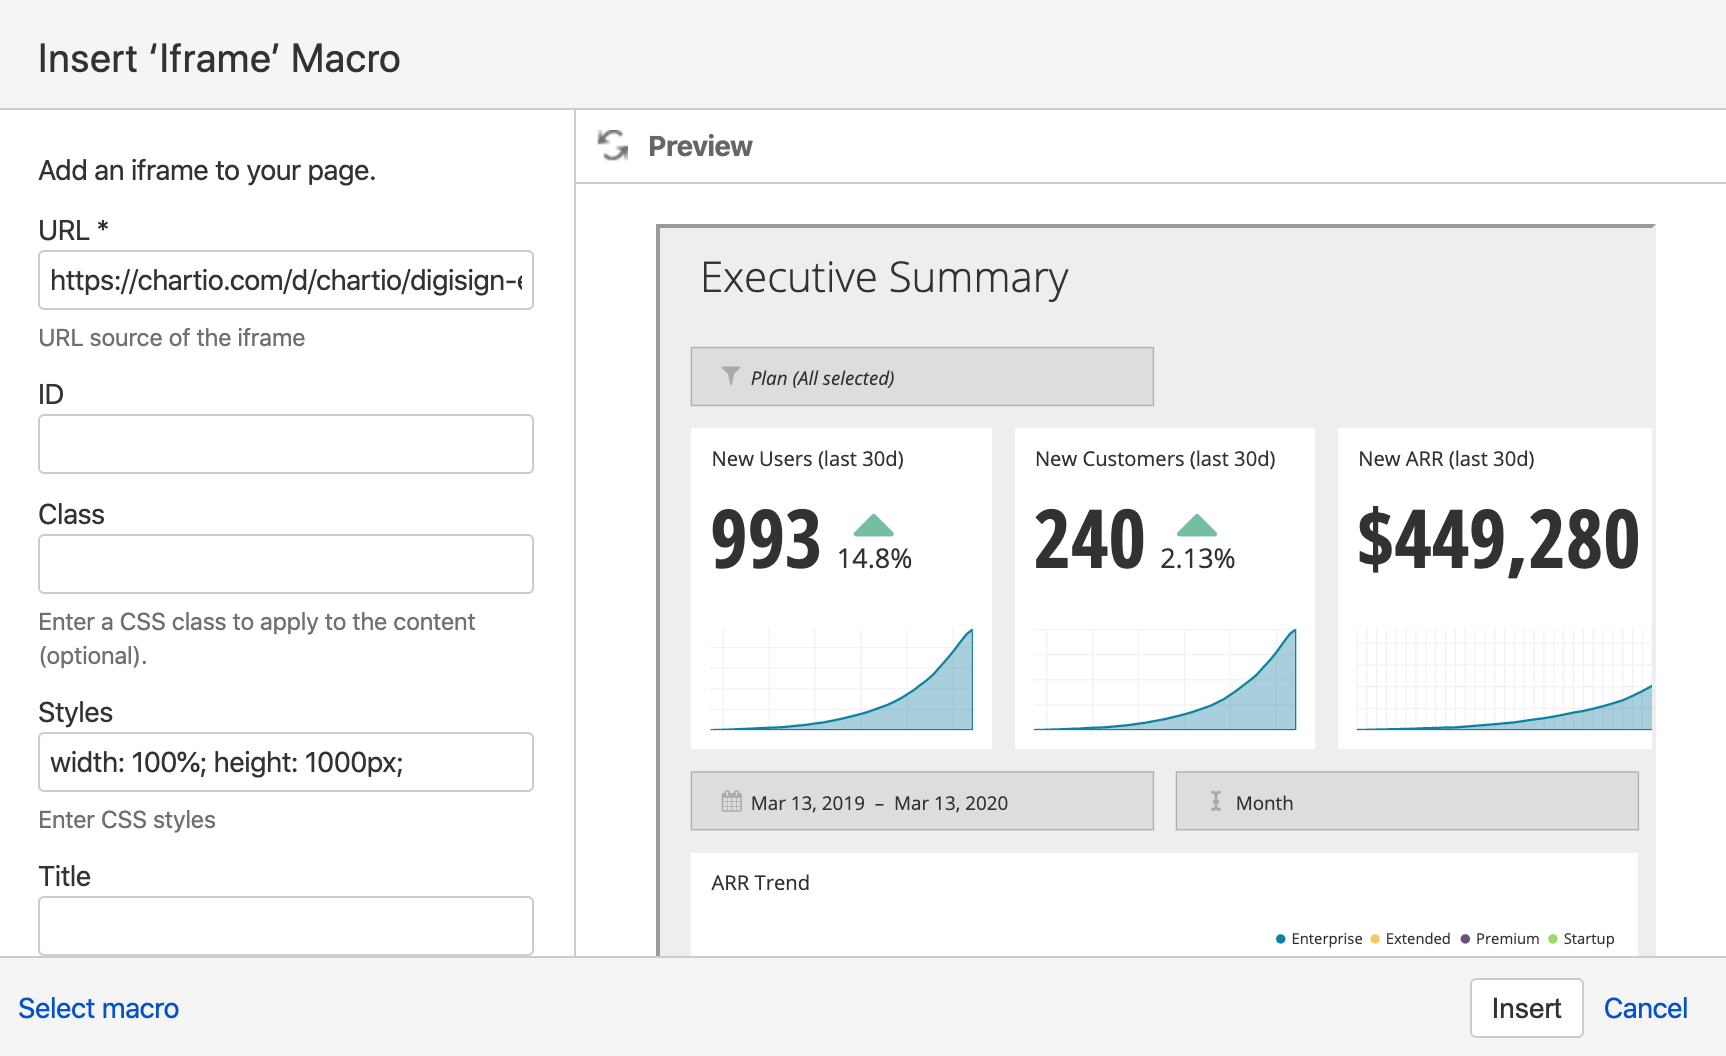
- You can optionally adjust the width and height to accommodate the size of your dashboard.
- Once you’re done editing your IFrame, click Insert. (If you’re editing an existing IFrame, click Save.)
-
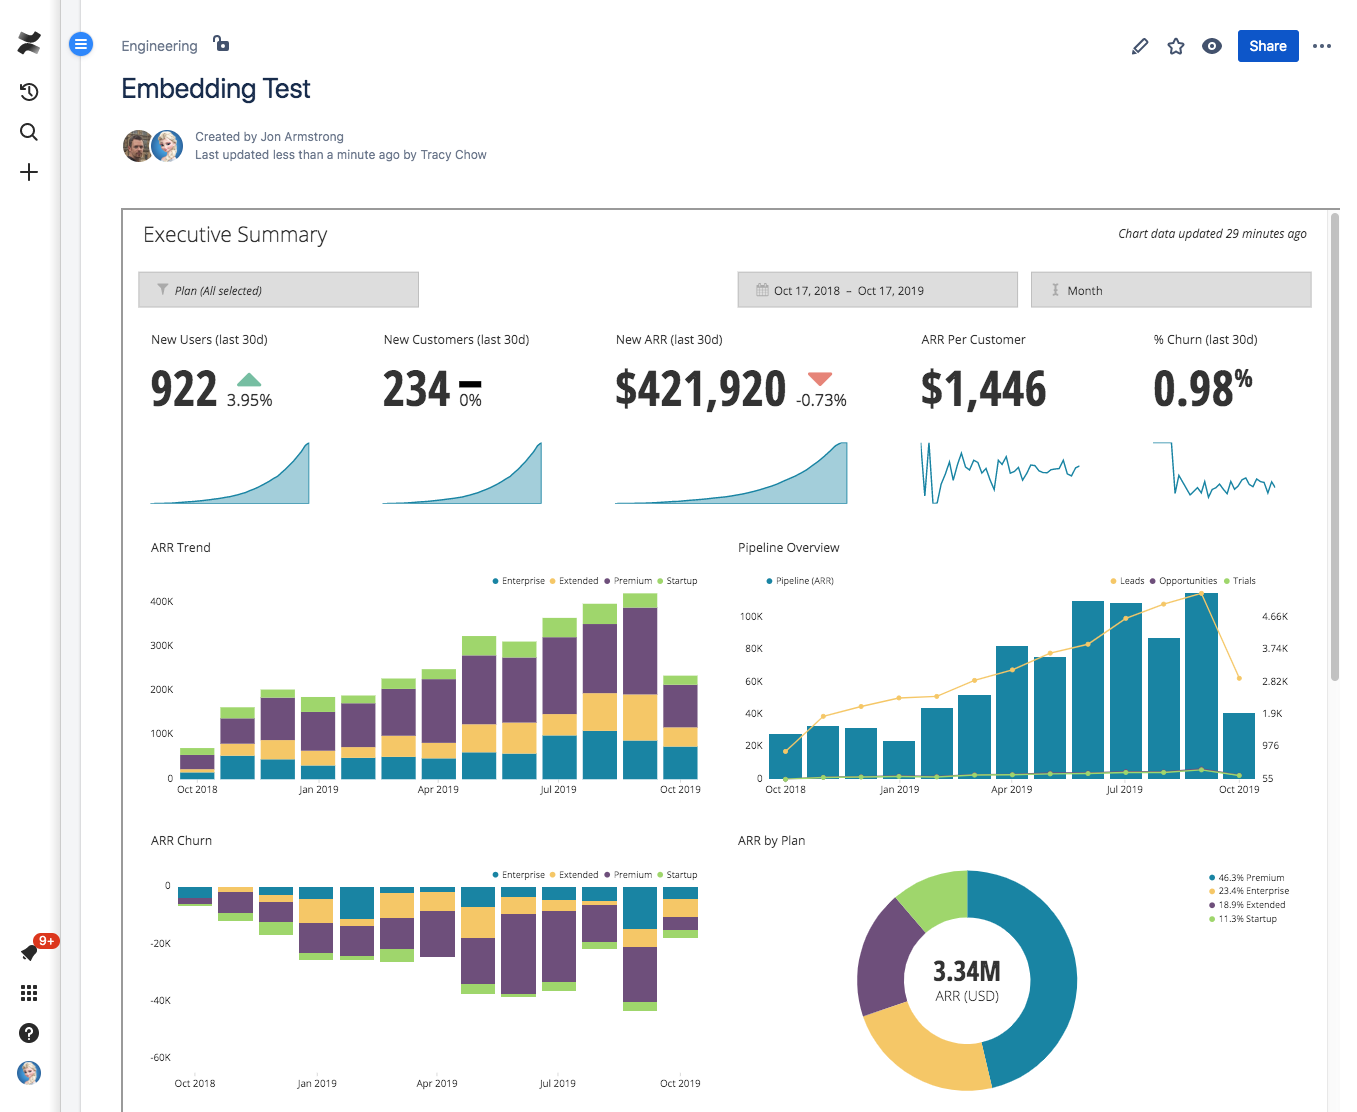
Publish your Confluence page so you and the other page viewers can see your embedded Chartio dashboard!
Troubleshooting
“Not Logged In” message
Confluence users must be logged into Chartio to view the embedded dashboard. If they’re not logged in, they’ll get a message directing them to the Chartio login page, as seen below:
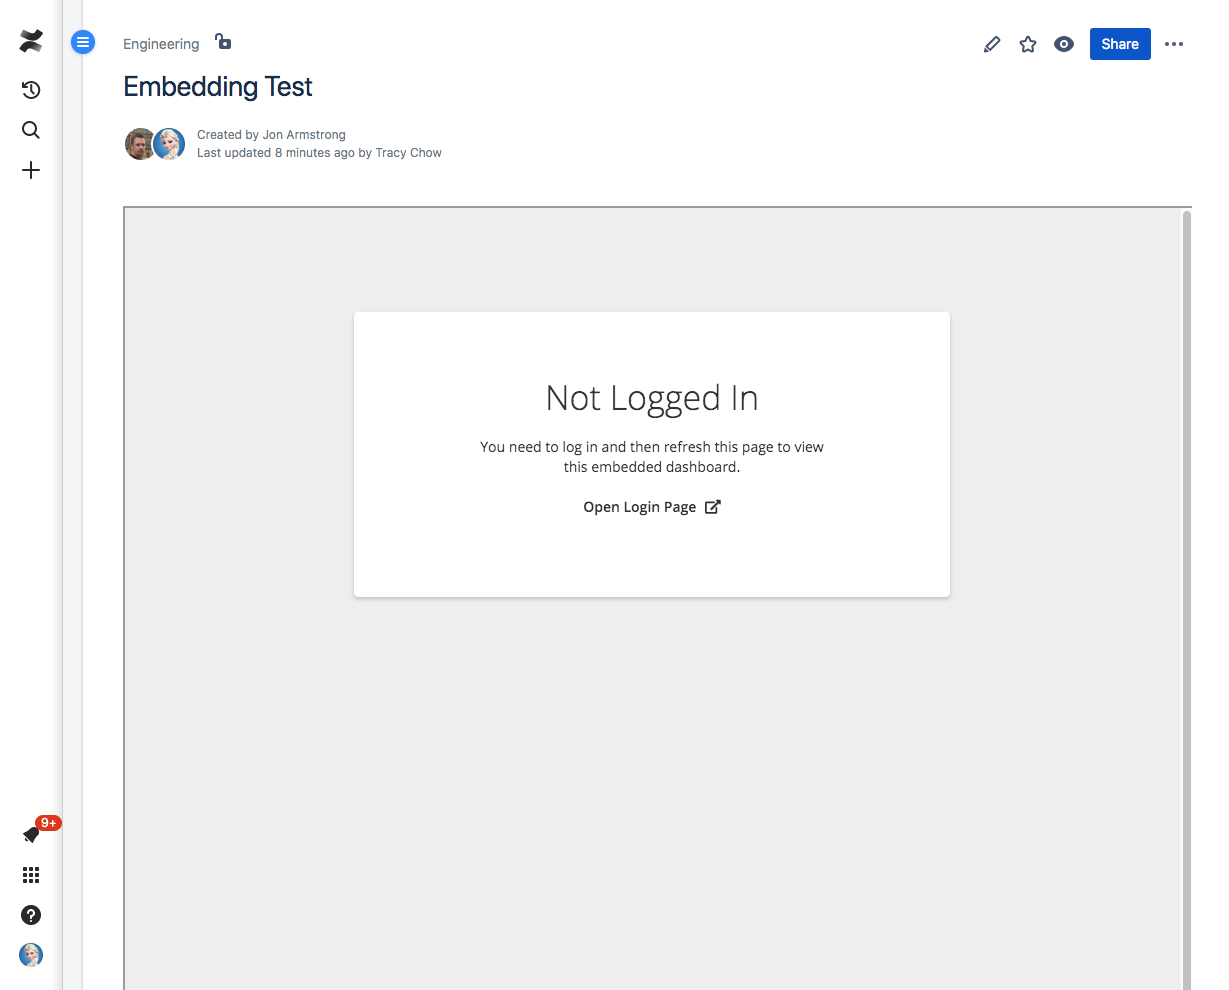
Upon seeing the message, the user can click Open Login Page to open Chartio in a separate tab and enter their username and password. Once they’re logged into Chartio, they can simply reload the Confluence page and the embedded dashboard will display.
Controls not working
If the Controls on your embedded dashboard aren’t responsive to mouse clicks, you’ll need to enable the Allow Viewers to Apply Dashboard Variables checkbox on the dashboard’s Embedding page.

To access your dashboard’s Embedding page, open your dashboard settings and click Embed in the top-right corner.
