Manage Controls
Once you’ve added some Dashboard Controls, they won’t be much help until you connect them to charts, which can be done in both Visual Mode and SQL Mode. However, using Dashboard Controls isn’t confined to only Query steps. Explore more uses of Dashboard Controls to leverage them in Chartio.
- Connect Controls to charts
- More uses of Dashboard Controls
- Edit Controls
- Reset Control values
- Delete Controls
If you’re having trouble with any of your Dashboard Controls, check out at our Troubleshooting tips.
Connect Controls to charts
Note: These instructions assume you have already added a Dashboard Control.
In Visual Mode
- Open the chart to which you’d like to connect your Dashboard Control.
- Controls filter columns, so you’ll need to add the column to filter under the Filters section.
-
As usual, choose the appropriate filter operator, but for the value, select your Control from the values list. The Control name will be wrapped in curly braces (e.g.,
{CONTROL_NAME}).For datetime Controls, such as Date Sliders and Calendars, you can append
.STARTor.ENDto the Control name to connect either the start or end date of your Control, respectively (e.g.,{CALENDAR_NAME.START}). Check out the other available datetime functions you can leverage in Chartio. - When you’re ready, click Run Query to apply your new filter. Make sure to save your chart to keep your changes!
In SQL Mode
Chartio has a special syntax that will allow you to use your Dashboard Controls easily in SQL Mode.
- Open your chart in SQL Mode.
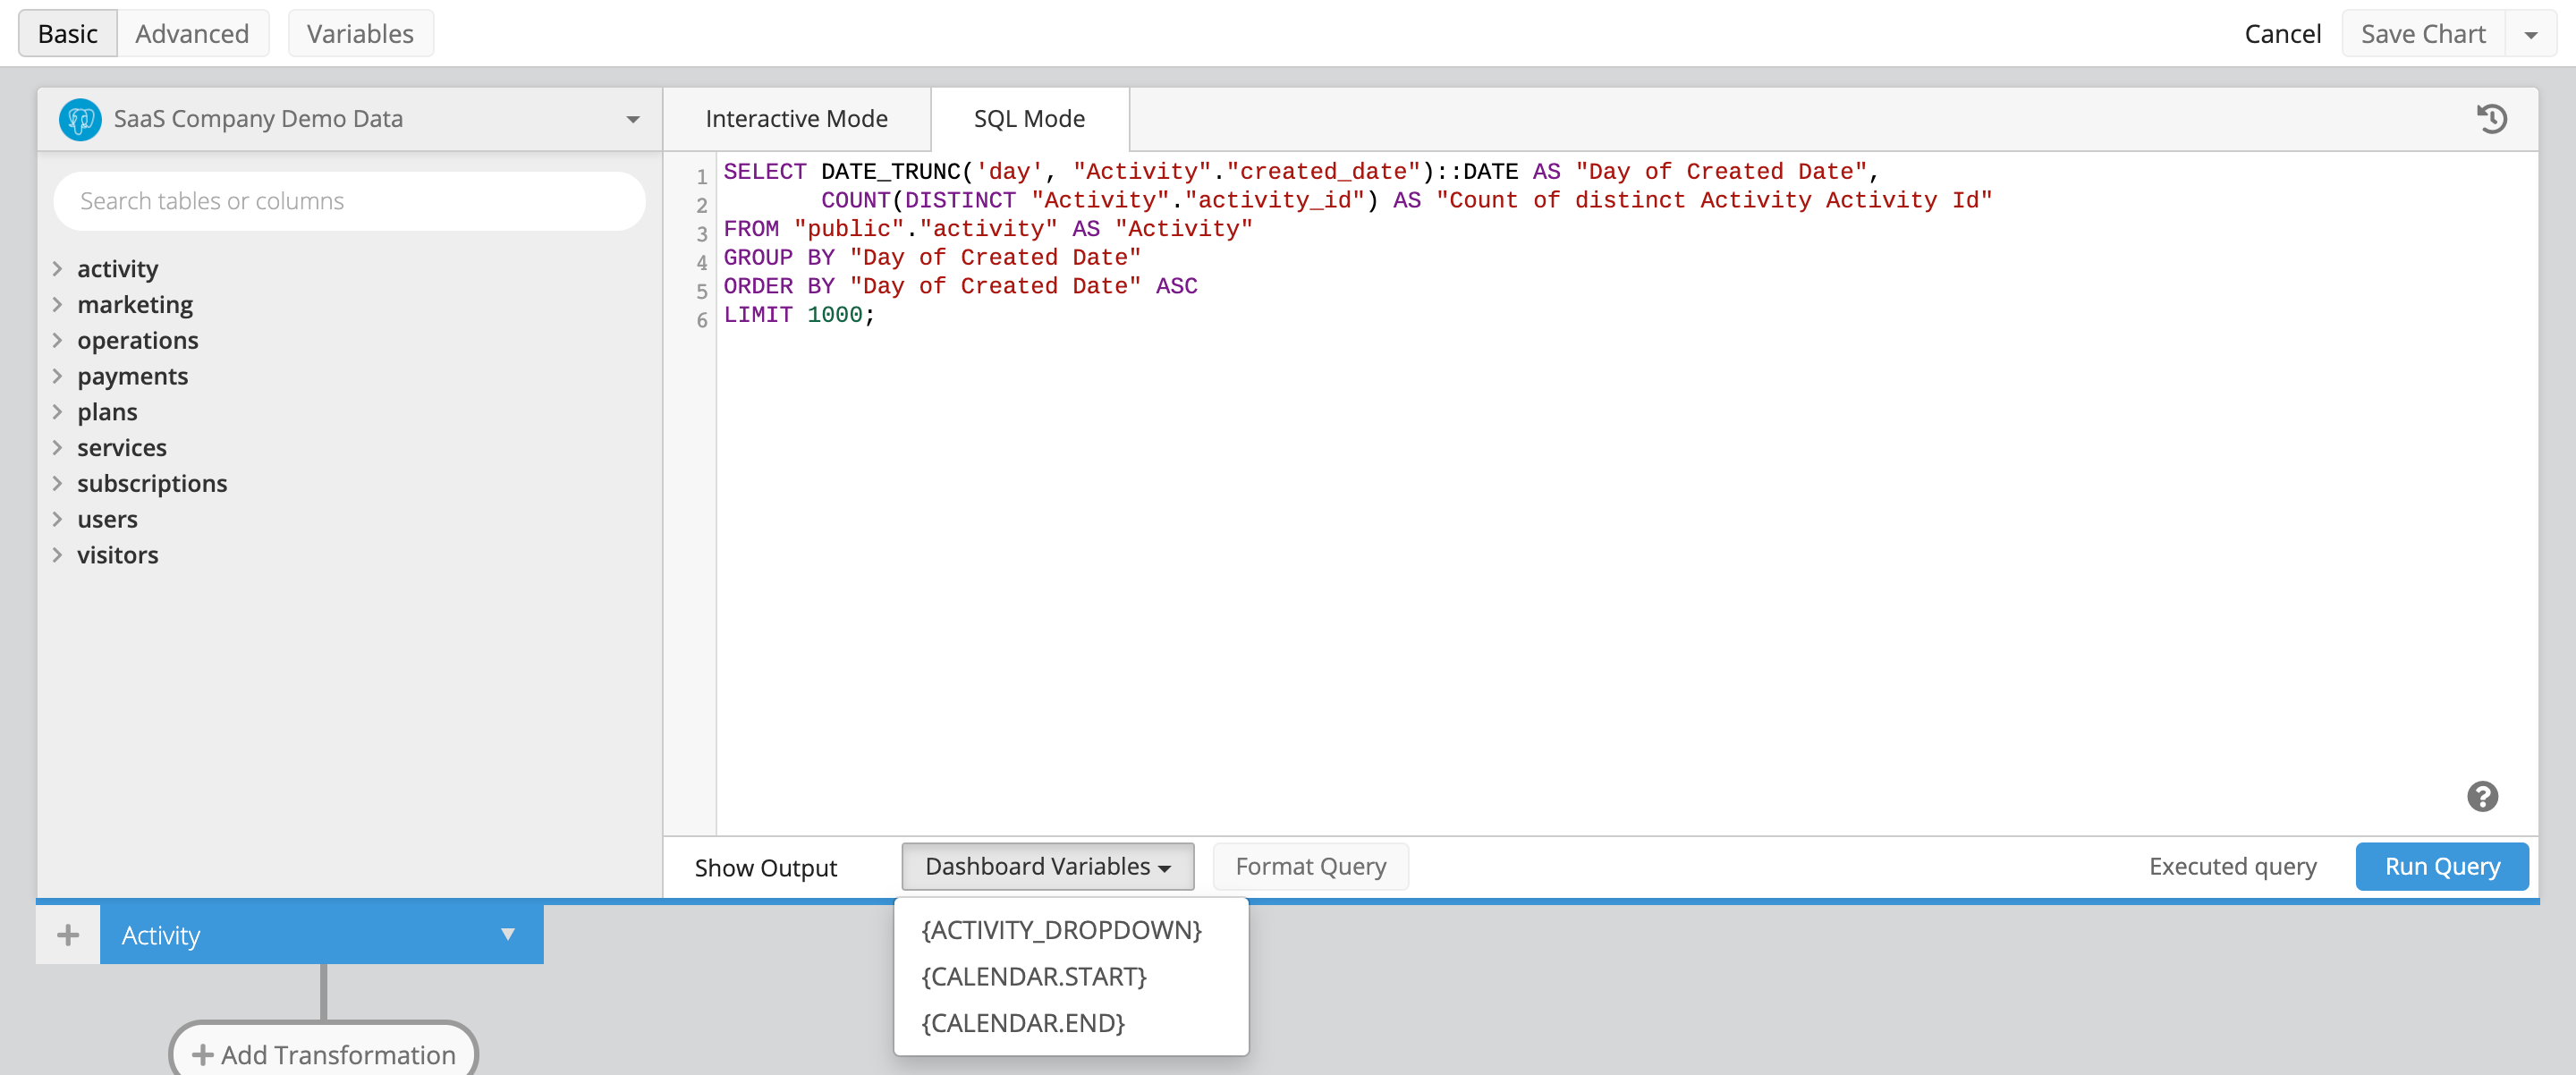
- You should see a dropdown menu labeled Dashboard Variables. Open it, and select a Control from the list. That Control will be inserted into your query where the cursor is placed.
To learn more about the different SQL syntaxes for Dashboard Controls, check out our SQL Mode Syntax for Controls page.

More uses of Dashboard Controls
Besides chart filters, you can also use Dashboard Controls in:
- Data Pipeline formulas and some Data Pipeline steps (Filter, CASE statement)
- Chart titles
- Text elements
- Column names (Can be used in both Interactive Mode and SQL Mode. For Interactive Mode, set the label.)
Edit Controls
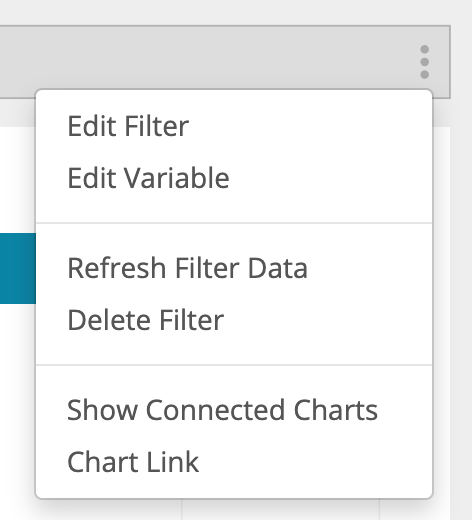
To edit an existing Dashboard Control, open your dashboard settings (by selecting Settings from the dashboard’s sidebar menu) and switch to the Variables tab. You can also get to this tab, by selecting Edit Variable from your Control’s menu options.
From the Variables tab, you can edit the Controls’ default, format, and background color.

Edit Filter
Some Controls like Dropdowns and Date Sliders are built using a database query and can be further edited with the option of adding Data Pipeline Steps to modify the results. To do this edit, use the Edit Filter option in the Control’s menu option to open up the Data Explorer.

Reset Dashboard Control values
To reset a dashboard’s Controls to their default values, click on the Reset values button below the Control list in the Variables tab.
You can also reset the Controls by clicking on the dashboard title on the top left corner of any dashboard.

Delete Controls
To delete a Dashboard Control from your dashboard, open the ellipsis menu of the Control to be deleted then click Delete Filter.
Troubleshooting
Query log
If you are experiencing any formatting errors related to your Dashboard Controls, one of the best places to start troubleshooting is the query log. In the query log, you can view how Chartio translates your Dashboard Control syntax into a SQL query, and how the query changes when specific values are selected.
For more information on accessing the query log, see our query log documentation.
Executed query
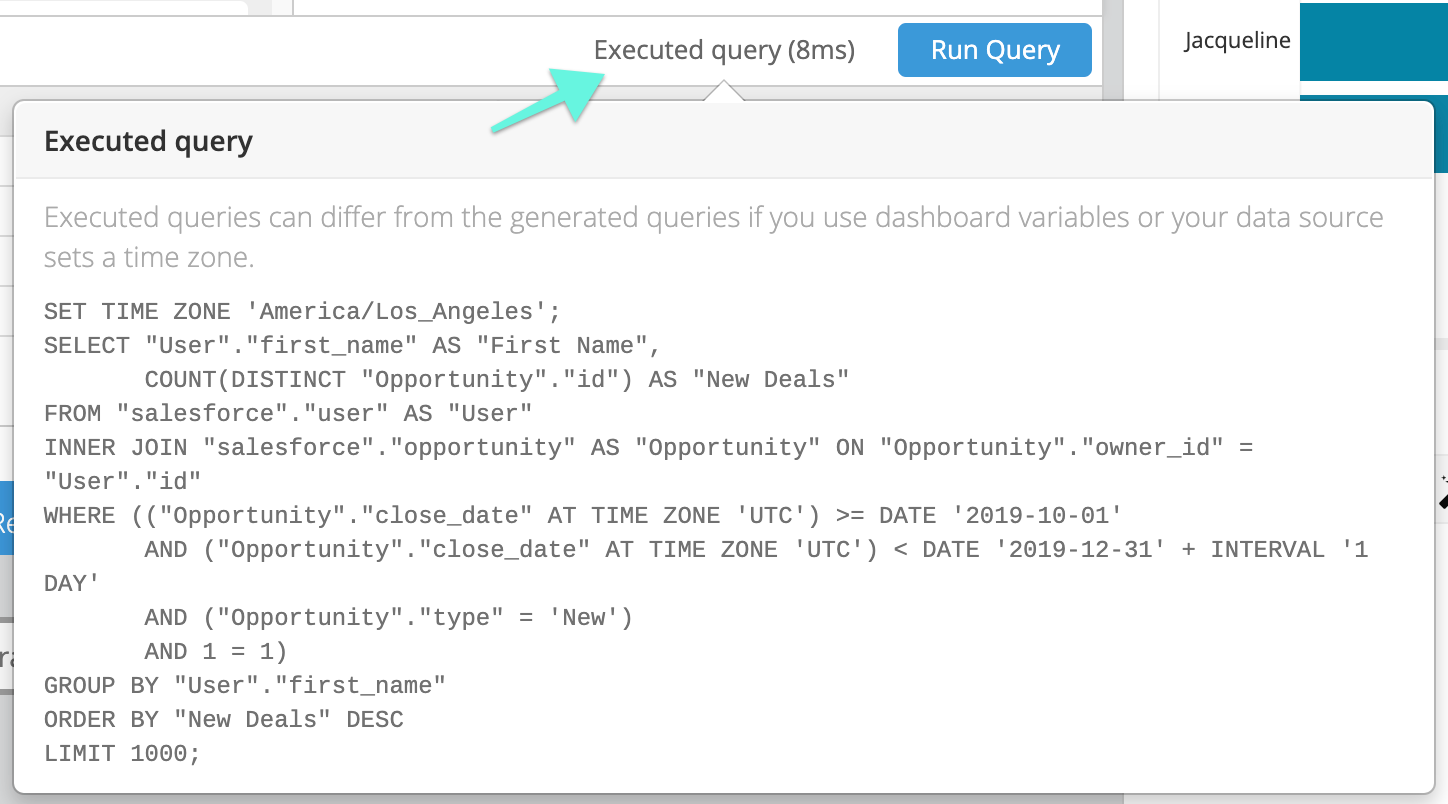
To troubleshoot specific Control values used in a chart, use the Executed query view in the chart’s Data Explorer. Clicking on the Executed query option next to the Run Query button will open up the latest query ran for your chart with the actual Control values added to the query.

If your filters aren’t working as expected, see if the values are coming up as expected in the query and try modifying the filter options in your chart before running the query again. This allows you to view how the query results change based on different Control values.
Connected charts
Quickly verify if your charts are correctly connected to any of your Dashboard Controls by opening a Control’s ellipsis menu then clicking Show Connected Charts. This will highlight all charts in the dashboard that are connected to that particular Control.